Figure 8:

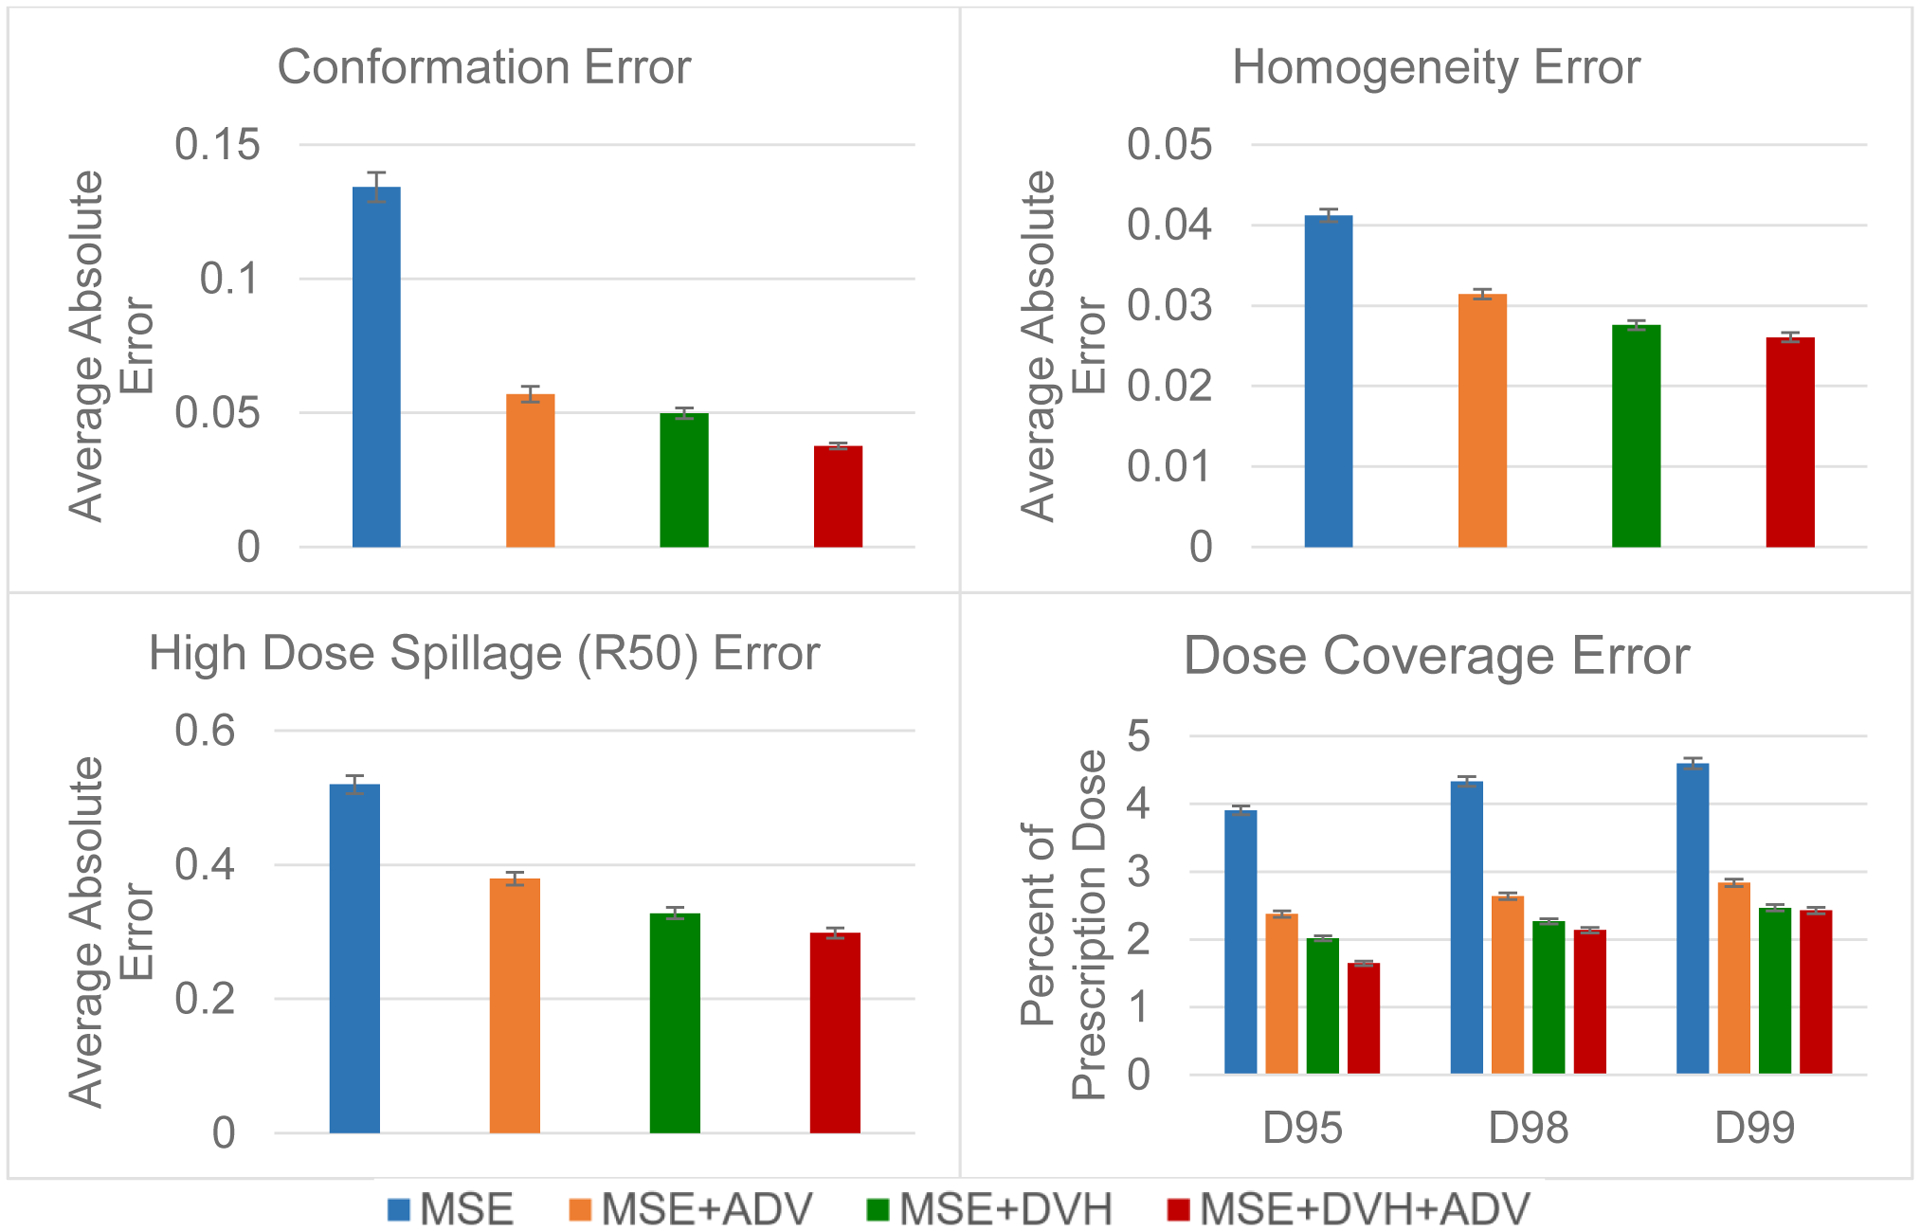
Predicion errors for conformation, homogeneity, high dose spillage (R50) and dose coverage on the test data. Error bar represents the 99% confidence interval , taken overall all test patients and plans.

Predicion errors for conformation, homogeneity, high dose spillage (R50) and dose coverage on the test data. Error bar represents the 99% confidence interval , taken overall all test patients and plans.