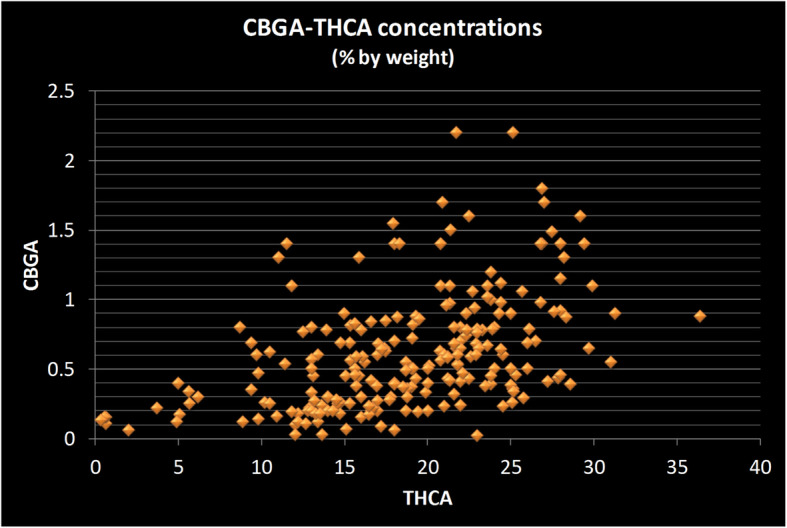
Fig. 3.

Scatter plot of CBGA versus THCA concentrations in strains sold in the New Jersey medicinal marijuana program. Each data point represents two values from a single strain: its concentration of Cannabigerolic acid (CBGA) and of Tetrahydrocannabinol acid (THCA). The strains with the highest concentration of CBGA (Y-axis) are those with on the high end of the THCA concentrations (X-axis). The relationship is not a clear one, however, as there are strains near the highest in THCA concentration (> 25%) which have only moderate CBGA concentration. All measurements done by the State of New Jersey’s Public Health and Environmental Laboratories using chromatographic methods and reported as percentage by weight
