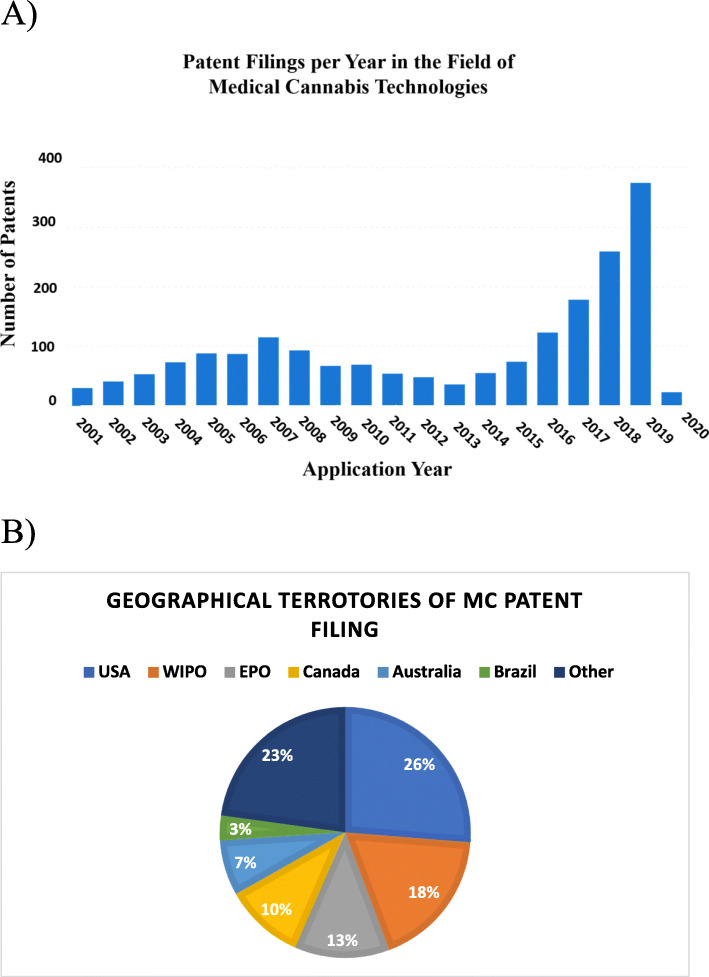
Fig. 1.
Overview on utility patents in the field of medical cannabis. a Graphically depicts the patent filing rate from 2001 to 2020. The total number of medical cannabis-related utility patents is represented in each column. b Graphical depiction of the main countries in which the MC-related utility patents were filed. The figures were generated using “Insights,” an analytic tool by Patsnap (https://www.patsnap.com). For more information on the PatSnap software operations, see the “Materials and methods” section

