
. 2020 Oct 12;14(2):183–188. doi: 10.4103/aer.AER_35_20
Copyright: © 2020 Anesthesia: Essays and Researches
This is an open access journal, and articles are distributed under the terms of the Creative Commons Attribution-NonCommercial-ShareAlike 4.0 License, which allows others to remix, tweak, and build upon the work non-commercially, as long as appropriate credit is given and the new creations are licensed under the identical terms.
Figure 8.
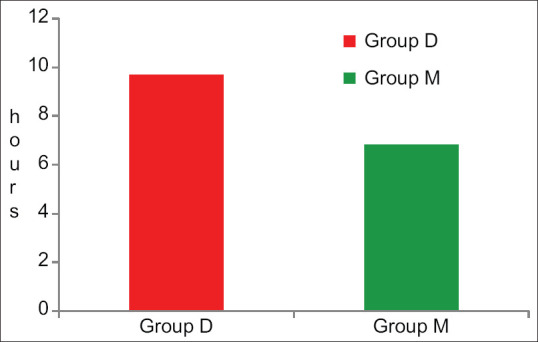
Graph showing comparison of duration of analgesia between two groups