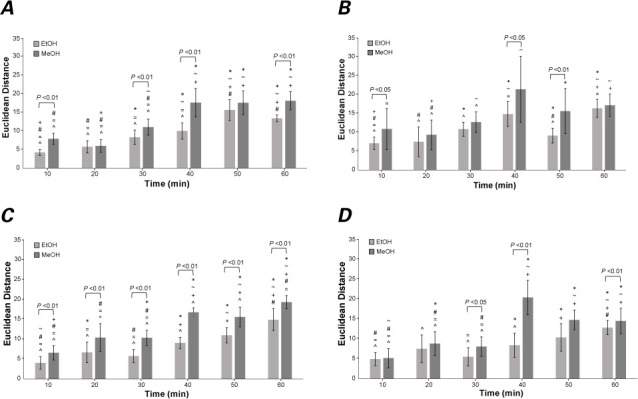
Fig. 4.

Bar graphs show mean Euclidean distances (EDs) between 2 colors in the CIELAB coordinate system (E*ab ) computed for A) left atrial appendage, B) atrial, C) ventricular, and D) septal tissues in contact with ethanol (EtOH) and methanol (MeOH) for the time periods indicated. Positive and negative standard error bars are shown for each data point. The symbols directly above each dataset (*, ~, +, #, =, and ^) correspond to time points 10, 20, 30, 40, 50, and 60 min, respectively, and indicate significant differences (P <0.01) between EDs in pairs of time points. The brackets above pairs of bar graphs indicate significant differences ( P <0.05) between the EtOH and MeOH results for particular time points.
