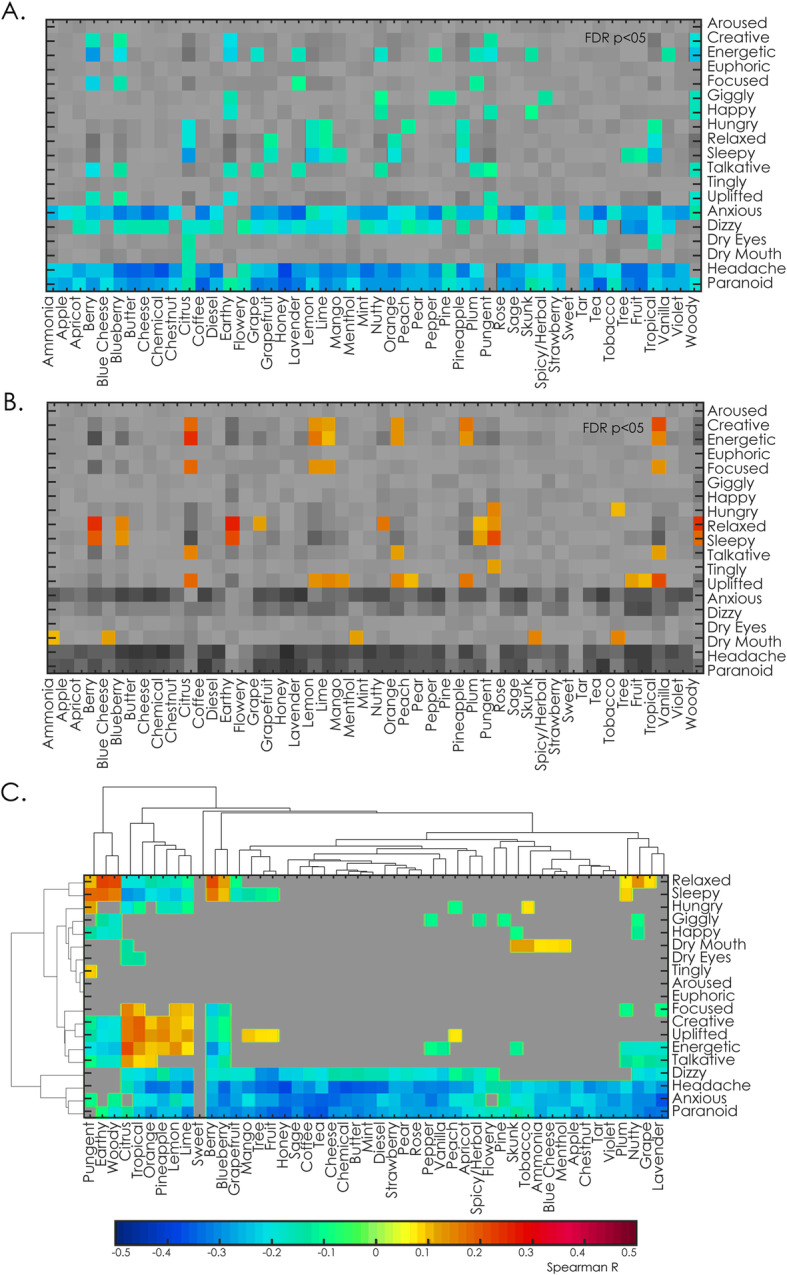
Fig. 3.

Associations between effects and flavours. A. Significant negative Spearman correlations between effects and flavours. B. Significant positive Spearman correlations between effects and flavours. In both panels significant correlations are indicated using a color scale. Both panels were thresholded at p < 0.05, FDR-corrected). C. Both positive (Panel A) and negative (Panel B) values grouped by hierarchical clustering of the effects and flavours according to their correlations. Hierarchical clustering was determined by the standard method included in Scipy (agglomerative clustering based on the Euclidean distance)
