
Figure 1: Heatmap of 18F-flortaucipir Retention.
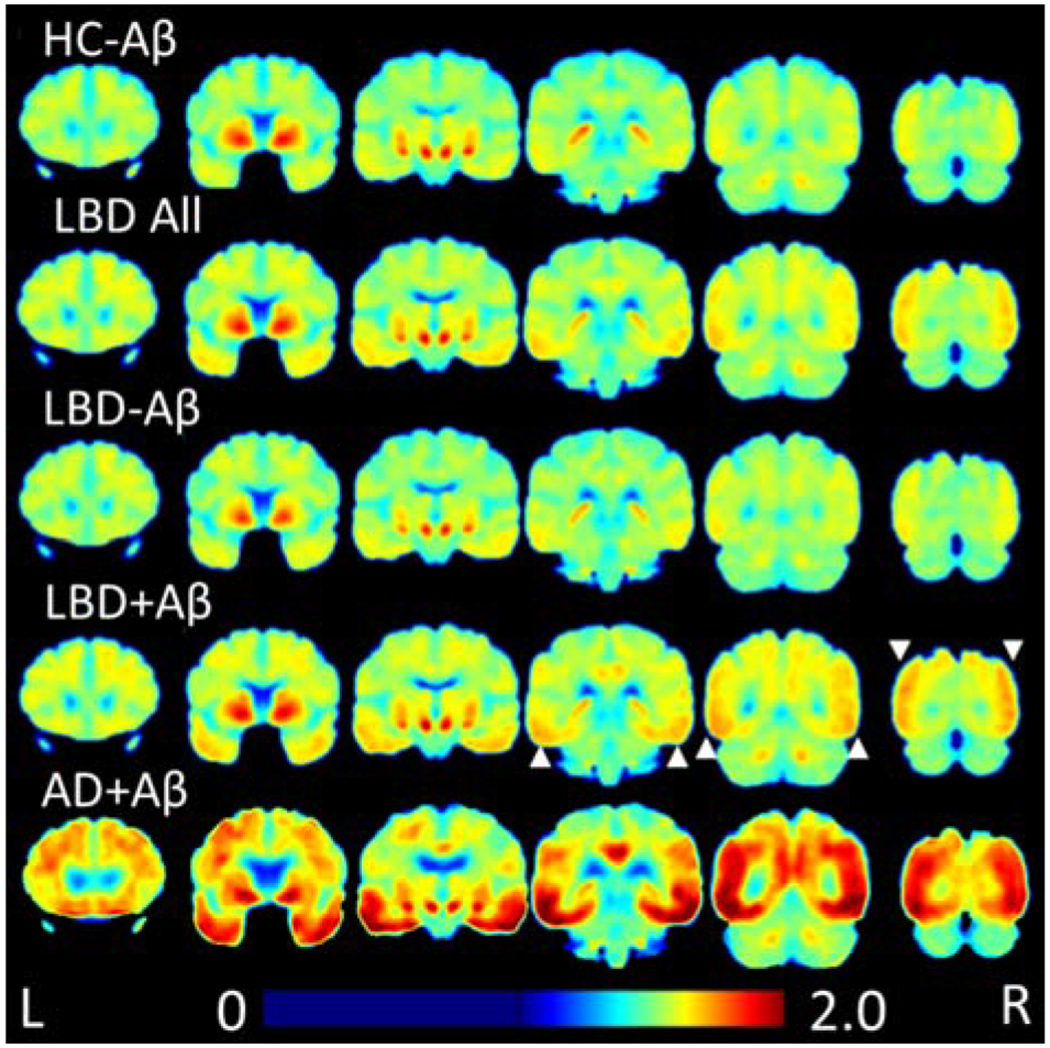
Average 18F-flortaucipir uptake for each group is shown in coronal sections. LBD+Aβ has higher uptake than HC-Aβ in posterior regions, indicated by white arrows. LBD-Aβ is very similar to HC-Aβ. LBD uptake in both LBD-Aβ and LBD+Aβ is less than AD+Aβ.