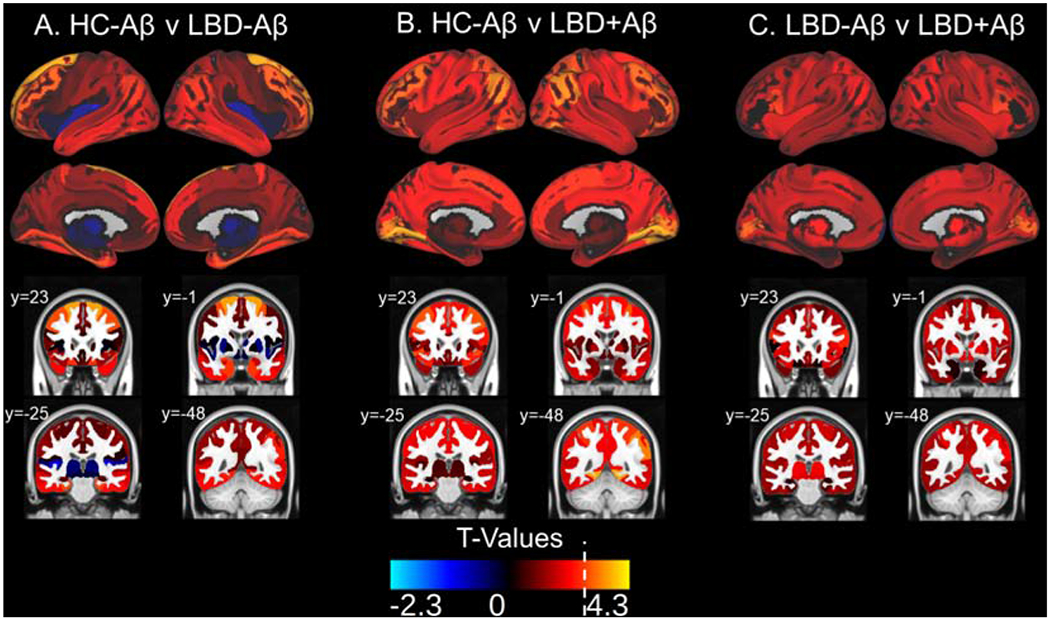
Figure 3: 18F-flortaucipir Retention Patterns in LBD versus HC-Aβ.

Surface projections and representative coronal sections show t-values associated with the following comparisons in each region of interest: A) HC-Aβ versus LBD-Aβ, B) HC-Aβ versus LBD+Aβ, C) LBD-Aβ versus LBD+Aβ, with positive t-values corresponding the latter group in each comparison. LBD+Aβ has increased uptake over HC-Aβ in frontal, parietal, temporal, and occipital regions with relative sparing of the medial temporal lobes. The white broken line on the t-value color scale indicated the t-value relating to p=0.01. No negative t-values reached significance. Example coronal slices show regional t-values projected onto the standardized brain atlas derived from Montreal Neurological Institute (MNI) with labeled y-axis coordinates.
