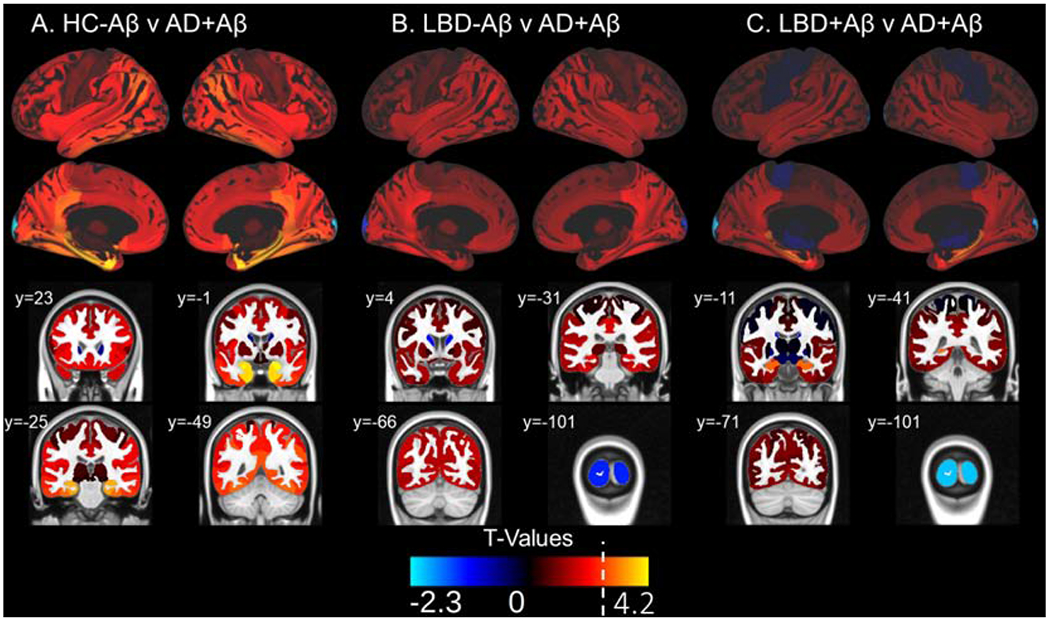
Figure 4: 18F-flortaucipir Retention Patterns in AD+Aβ versus HC-Aβ and LBD.

Surface projections and representative coronal sections show t-values associated with the following comparisons in each region of interest: A) C) HC-Aβ versus AD+Aβ, B) LBD-Aβ AD+Aβ and C) LBD+Aβ versus AD+Aβ with positive t-values corresponding to the latter group in the comparison. AD+Aβ has increased uptake over HC-Aβ in medial temporal lobe areas as well as temporal, frontal and parietal regions. AD+Aβ has higher uptake that LBD in the hippocampus. A white line on the t-value scale marks the level corresponding to p=0.01 in this analysis. No negative t-values reached significance. Example coronal slices show regional t-values projected onto the standardized brain atlas derived from Montreal Neurological Institute (MNI) with labeled y-axis coordinates.
