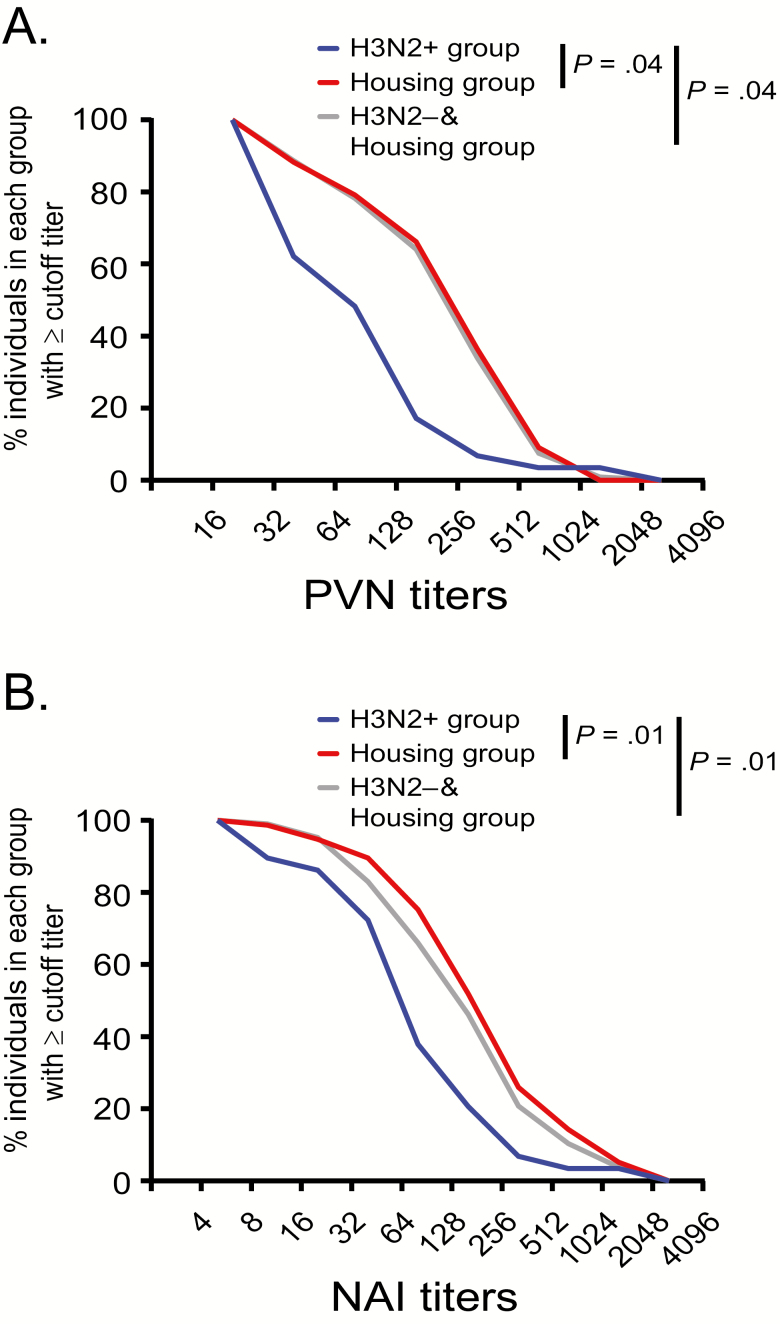
Figure 3.
Reverse cumulative distribution curves. The percent of individuals with (A) PVN IC95 and (B) NAI IC50 titers less than or equal to the shown titers is plotted for the H3N2+ (blue curve), housing (red curve), and H3N2− and housing control (light gray curve) groups. Differences between the groups and titers were analyzed using 2-way analysis of variance. P values <.05 were considered significant. Abbreviations: NAI, neuraminidase inhibition; PVN, pseudovirus neutralization.

