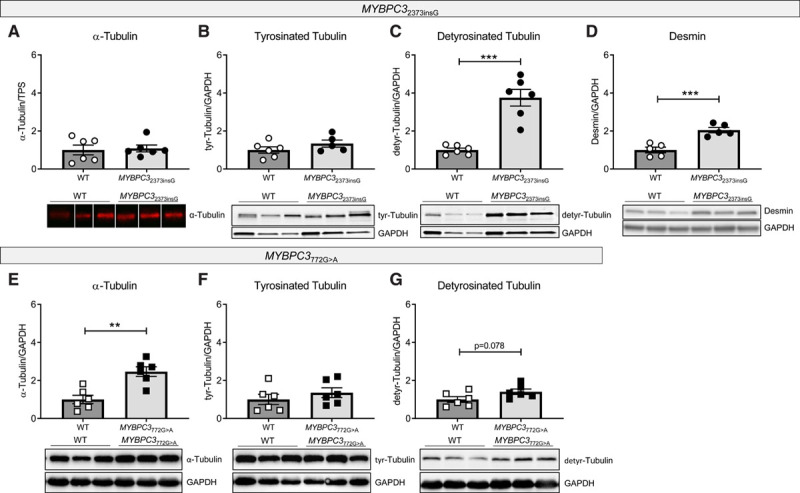
Figure 5.

Tubulin composition in MYBPC32373insG and MYBPC3772G>A mouse models. Quantification and representative Western blot images of (A) α-tubulin, (B) tyrosinated tubulin, (C) detyrosinated tubulin, and (D) desmin in MYBPC32373insG mice and (E) α-tubulin, (F) tyrosinated tubulin and (G) detyrosinated tubulin in MYBPC3772G>A mice, respectively. A is normalized to total protein stain (TPS, image provided in Figure XVD in the Data Supplement). B–G are normalized to GAPDH. Lanes in A were run on the same gel but were noncontiguous. n(wild type [WT]/MYBPC32373insG/MYBPC3 772G>A)=6/6 (4 females, 2 males/3 females, 3 males of 20–27 wk for MYBPC32373insG and the corresponding WT; 2 females, 4 males for of 55–59 wk for MYBPC3772G>A and the corresponding WT) for (A, C, and E–G), 6/5 (4 females, 2 males/3 females, 2 males; 20–27 wk) for (B) and 5/5 (3 females, 2 males/2 females, 3 males; 20–27 wk) for (D), unpaired 2-tailed t test, ***P=0.0001 in (C) and P=0.009 in (D), **P=0.0014.
