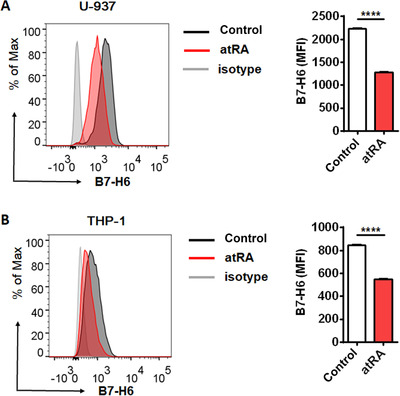
FIGURE 3.

atRA down‐regulates B7‐H6 cell‐surface expression on U‐937 and THP‐1 cells. U‐937 (A) and THP‐1 (B) cells were treated with 10 μmol/L atRA or left untreated (Control) for 24 h, followed by the analysis of cell surface B7‐H6 expression through flow cytometry. Data were analyzed for significance by the unpaired t test. Results are representative of at least three independent experiments with a minimum of two technical replicates and are expressed as the mean±SEM. MFI, mean fluorescence intensity; ****, P <0.0001.
