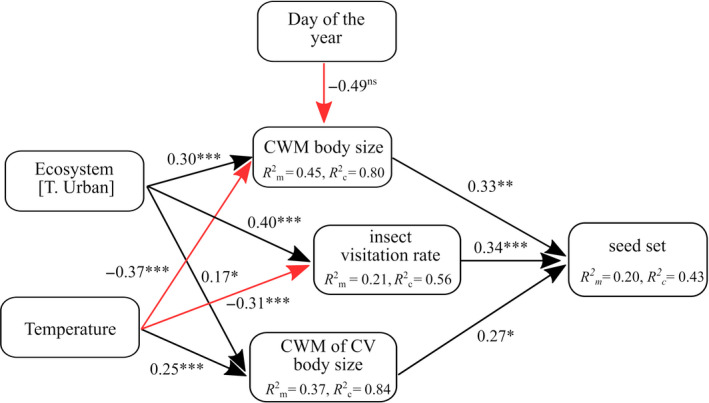
Figure 3.

Representation of the structural equation model of urbanization and ambient temperature when sampling, their relationships with bumblebee community‐weighted mean (CWM) body size and CWM of the coefficient of variation (CV) of body size, and the effects of visitation rates and body size on pollination. T. Urban, urban treatment of this categorical variable. Black solid arrows show positive and red arrows negative effects, as derived from the piecewise SEM analysis. Standardized path coefficients are reported next to the bold arrows and R 2 values (conditional R 2 c and marginal R 2 m) are reported for all response variables. ns not significant; *p ≤ .05; **p ≤ .01; ***p ≤ .001
