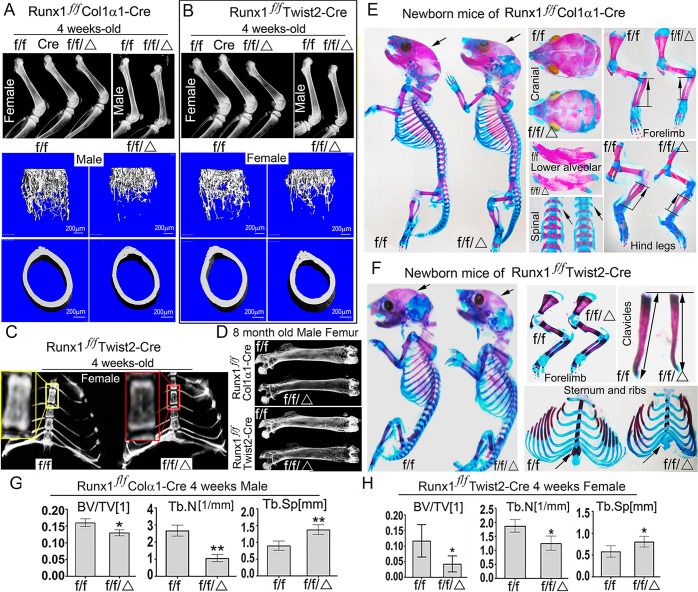
Fig 1. Runx1f/fTwist2-Cre and Runx1f/fCol1α1-Cre mice displayed a severe osteoporosis phenotype at postnatal and adult stages.
(A, B) Radiographic images and μCT scans of (A) 4-week-old Runx1f/fCol1α1-Cre (f/f/Δ) and control (f/f) mouse tibias, and (B) 4-week-old Runx1f/fTwist2-Cre (f/f/Δ) and control (f/f) mouse femurs. (C) Radiographic images of 4-week-old Runx1f/fTwist2-Cre (f/f/Δ) and control (f/f) mouse ribs and vertebrae. (D) Radiographic images of 8-month-old Runx1f/fTwist2-Cre (f/f/Δ) and control (f/f) male mice femurs, and 8-month-old Runx1f/f Col1α1-Cre (f/f/Δ) and control (f/f) mouse femurs. (E) Whole-mount Alizarin red and Alcian blue staining of newborn Runx1f/fCol1α1-Cre skeletons. Alizarin red and Alcian blue staining of newborn Runx1f/fCol1α1-Cre skulls, forelimbs, mandibles, hind legs, and spines. (F) Whole-mount Alizarin red and Alcian blue staining of newborn Runx1f/fTwist2-Cre skeletons. Alizarin red and Alcian blue staining of newborn Runx1f/fCol1α1-Cre forelimbs, clavicles, and sternum and ribs. (G) Quantification of bone volume/tissue volume (BV/TV), trabecular number (Tb.N), and trabecular space (Tb.Sp) of μCT scans in A. (H) Quantification of BV/TV, Tb.N, and Tb.Sp of μCT scans in B. Results are expressed as mean ± SD, n = 4 in each group. N.S, not significant. *p < 0.05, **p < 0.01, ***p < 0.001.

