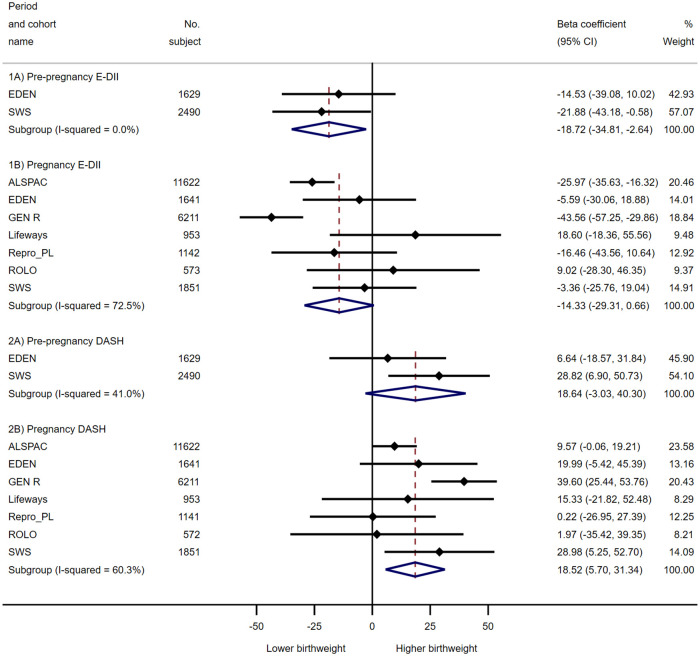
Fig 2. Forest plot showing adjusted associations of maternal E-DII and DASH scores (per 1-SD increase) during prepregnancy and pregnancy periods with birth weight.
Black dots indicate study-specific point effect estimates with corresponding 95% CIs indicated by horizontal lines, and diamonds indicate the pooled estimates with their corresponding 95% CIs. When studies were omitted one at a time for pregnancy DASH meta-analysis, the overall pooled estimates remained largely the same and remained statistically significant: range of beta coefficients = 11.7 to 21.6 g, all CIs did not include 0; for E-DII, beta coefficients (95% CI) range from −8.8 (−23.0, 5.5) g when excluding Gen R to −18.3 (−32.8, −3.8) g when excluding Lifeways. Effect estimates were adjusted for maternal education, ethnicity, prepregnancy BMI, maternal height, parity, energy intake (for DASH), cigarette smoking and alcohol consumption during pregnancy, and child sex. BMI, body mass index; DASH, Dietary Approaches to Stop Hypertension; E-DII, energy-adjusted Dietary Inflammatory Index.

