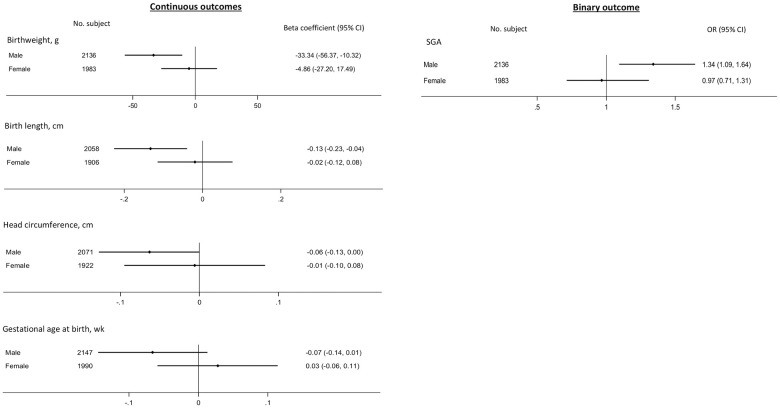
Fig 4. Forest plot showing sex-interaction between maternal prepregnancy E-DII score (per 1-SD increase) and offspring birth outcomes (only adjusted subgroup pooled estimates shown; all pooled P values of interaction term ≤0.10).
The pooled estimates shown were based on analyses conducted separately in males and females to aid visualization; for this downstream subgroup analyses to be conducted, all P values were ≤0.10 based on meta-analysis of within-cohort interaction estimates.

