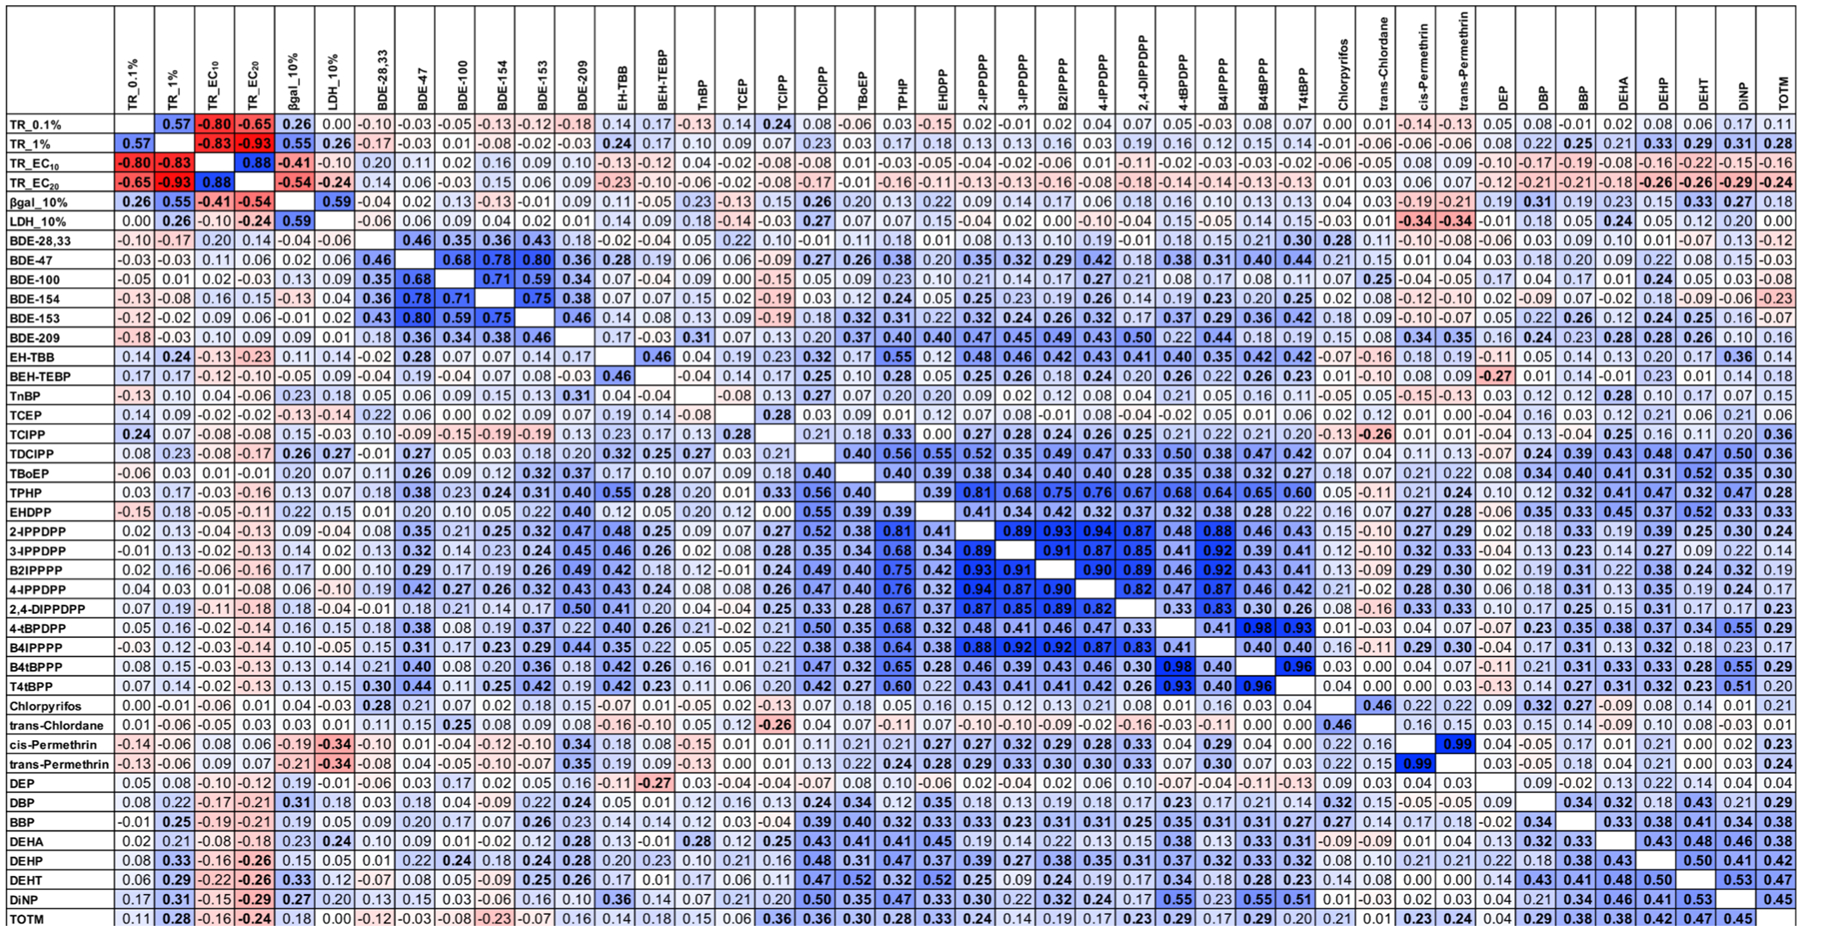
Figure 1.

Correlations among bioactivities and targeted chemical concentrations in wristband extracts. Spearman’s correlations between concentrations of targeted SVOC concentrations (only performed for chemicals with ≥60% detection) in silicone wristband extracts. Correlations performed using SAS 9.4; bolded samples represent significant (p < 0.05) correlations, and the color depicts the strength and direction of the correlation. Darker colors represent a stronger correlation, blue coloration depicts positive correlations, and red depicts negative correlations. TR_0.1% and TR_1% represent the efficacy/magnitude of TR antagonism at 0.1 and 1% wristband extract concentration, respectively. TR_EC10 and TR_EC20 represent the potencies of TR antagonism (concentration of wristband extract at which 10 or 20% TR antagonism was observed). β-gal and LDH represent the magnitude of cell viability inhibition for each of these assays at 10% wristband concentration.
