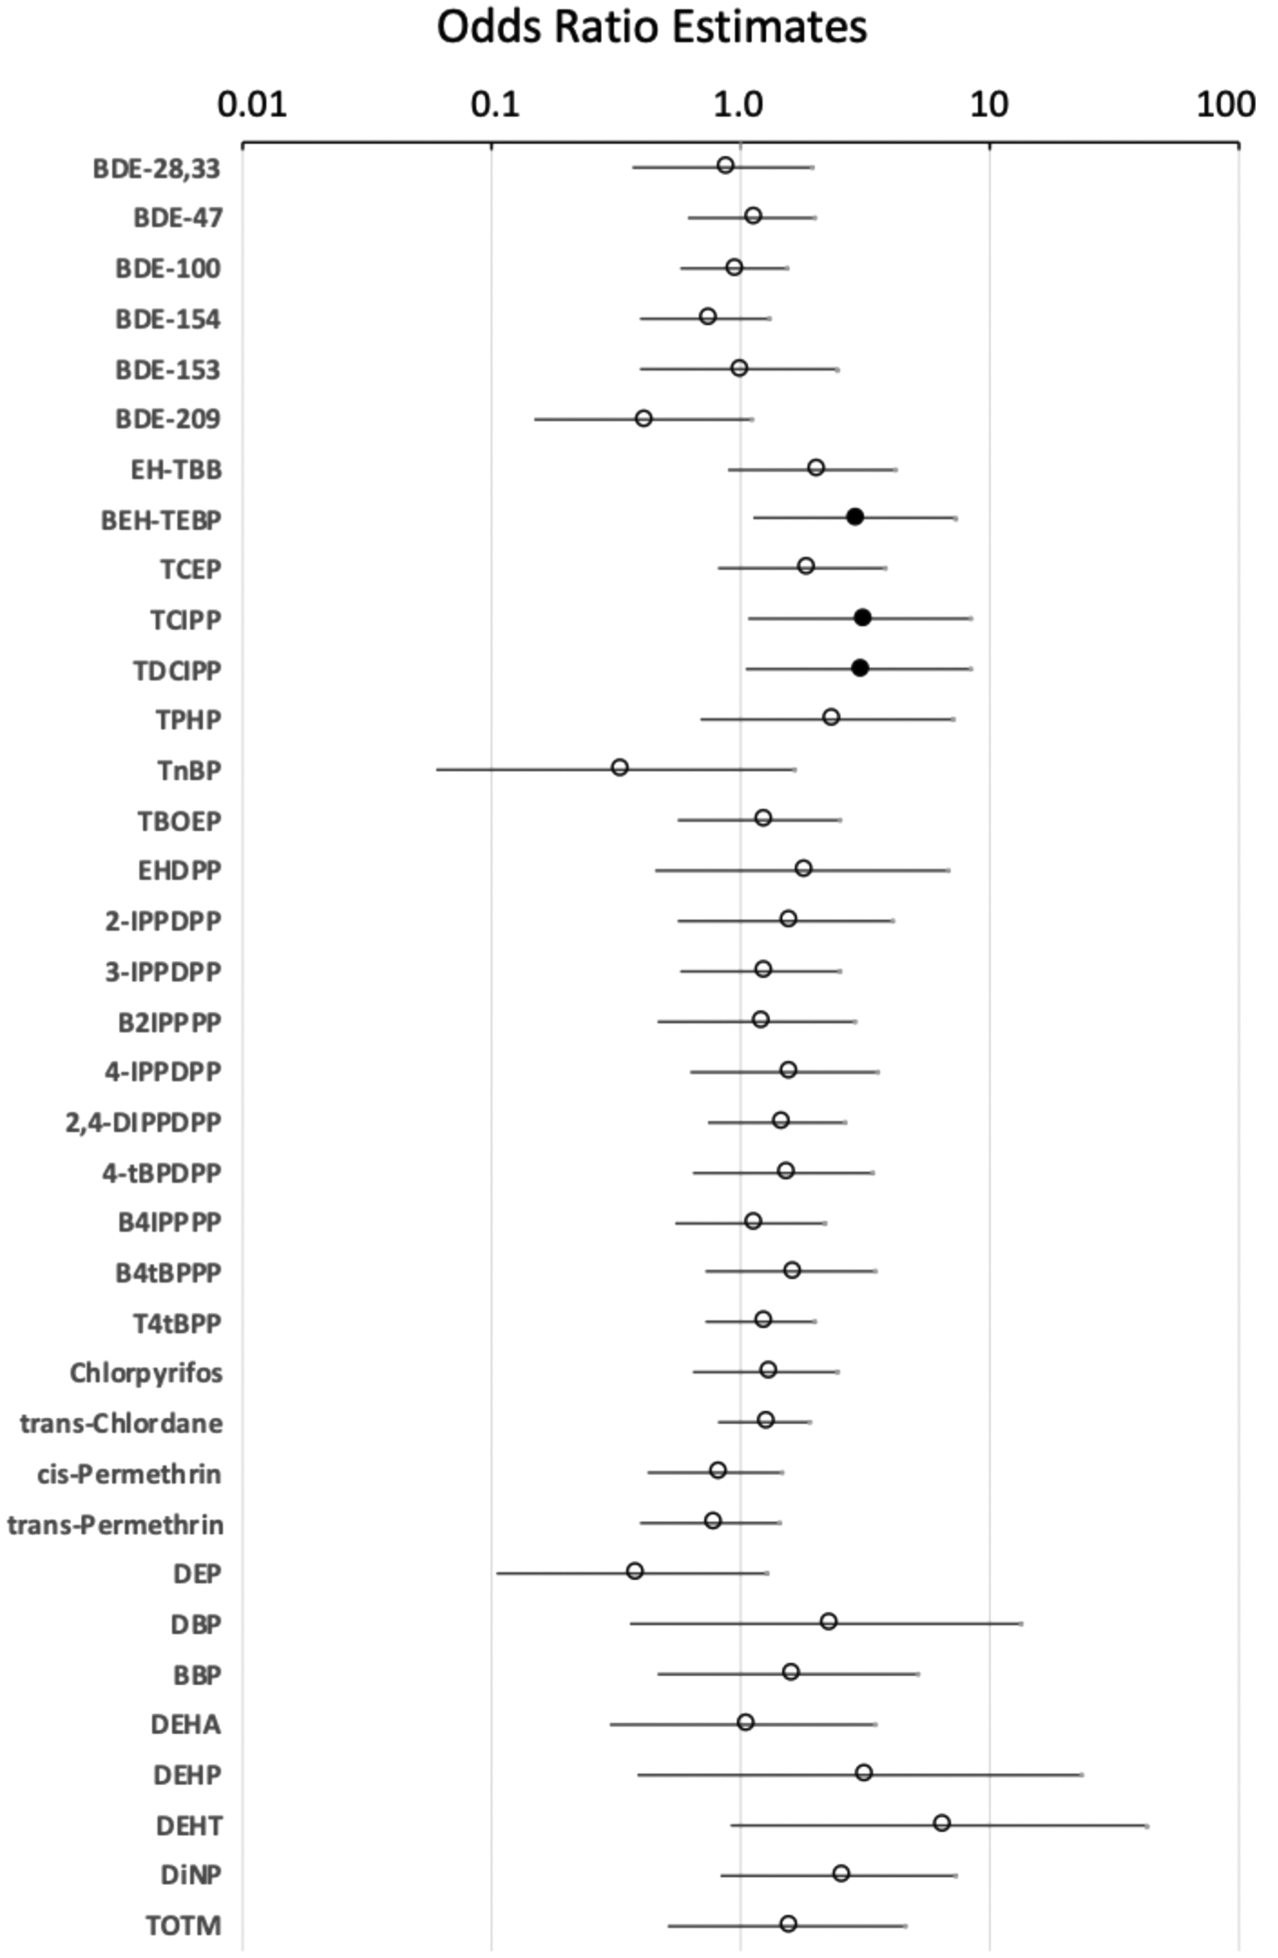
Figure 4.

TR antagonism regressions by chemical concentrations. Results of logistic regression models performed in SAS 9.4 using chemical concentrations in wristband extracts (log-transformed) and TR β antagonism as measured by reporter gene assay at 0.1% extract concentration. Log-transformed chemicals were included as a continuous measure, and antagonism as a logistic measure (inactive or active for significant antagonism). Filled circles denote significant difference between inactive to active samples for specific chemicals, and open circles denote insignificance. Odds ratios indicate the likelihood that the extracts will be active for TR antagonism with each log increase in chemical concentrations. Interpretation: TCIPP with an odds ratio of 3.0 suggests that for each log unit increase in TDCIPP, the likelihood that a sample will be active is approximately 3 times as high.
