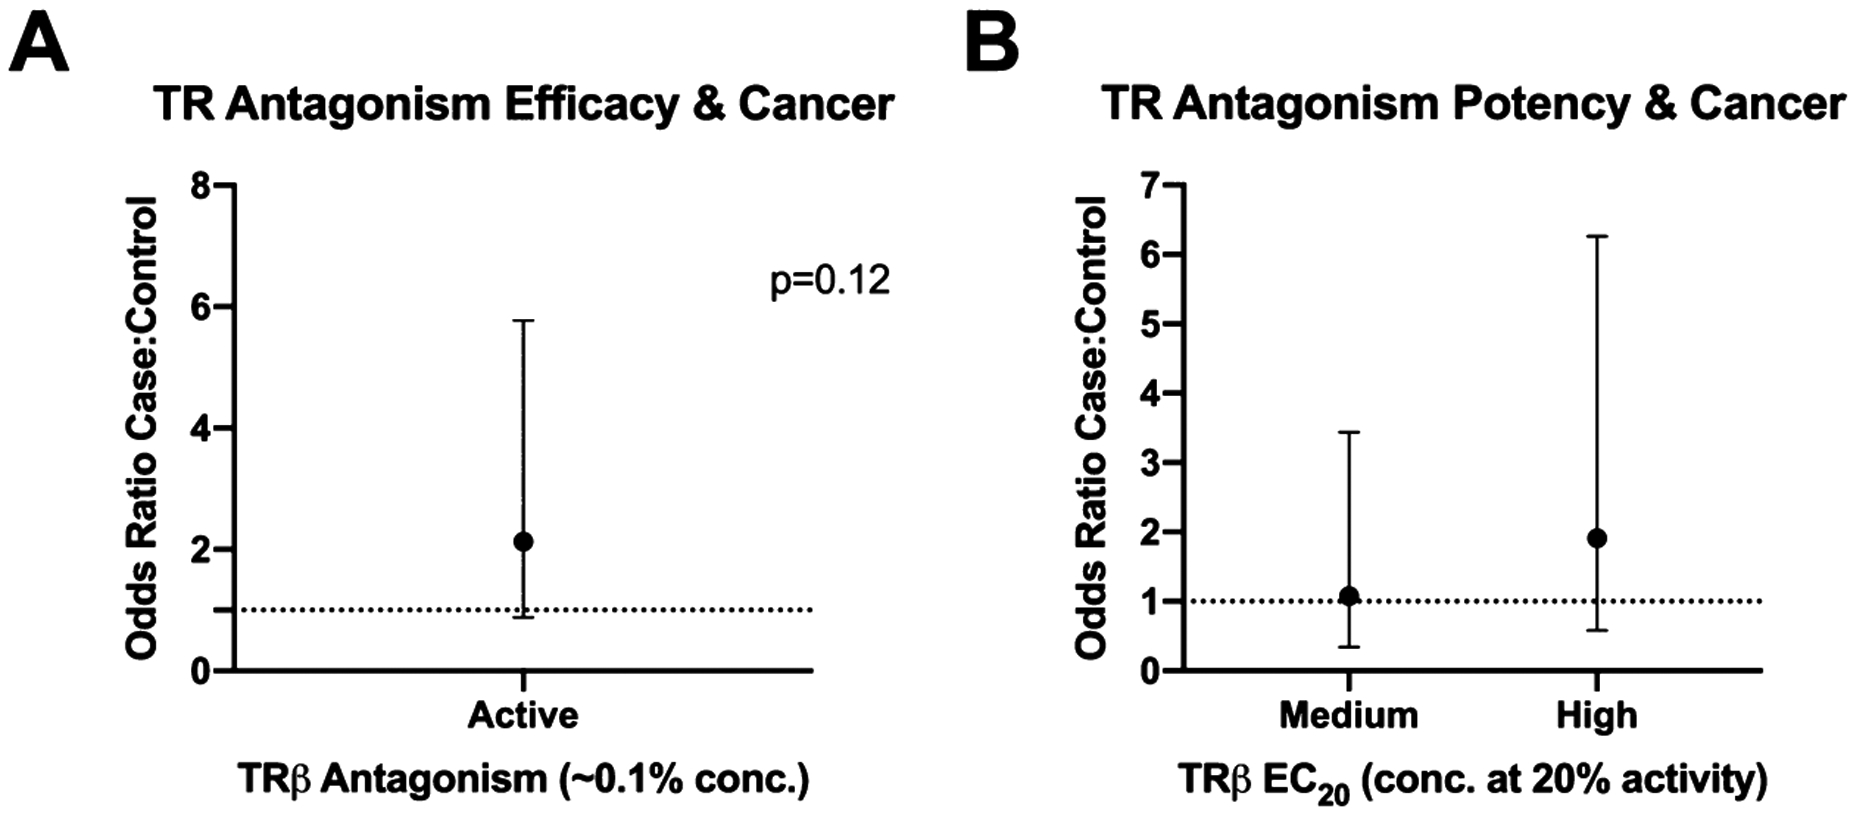
Figure 5.

TR antagonism and PTC case status. Logistic regression models performed in SAS 9.4 to assess relationships between TR antagonism metrics (maximal inhibition at 0.1% wristband extract concentration, potency of inhibition via concentration at which 20% of added agonist control was inhibited; EC20) and participant PTC status. These models controlled for potential confounding by race, BMI, and educational status, which we anticipated could be related to both exposure and health outcomes. Interpretation: odds ratio of 2.1 (A) suggest that active samples are approximately twice as likely to come from cases.
