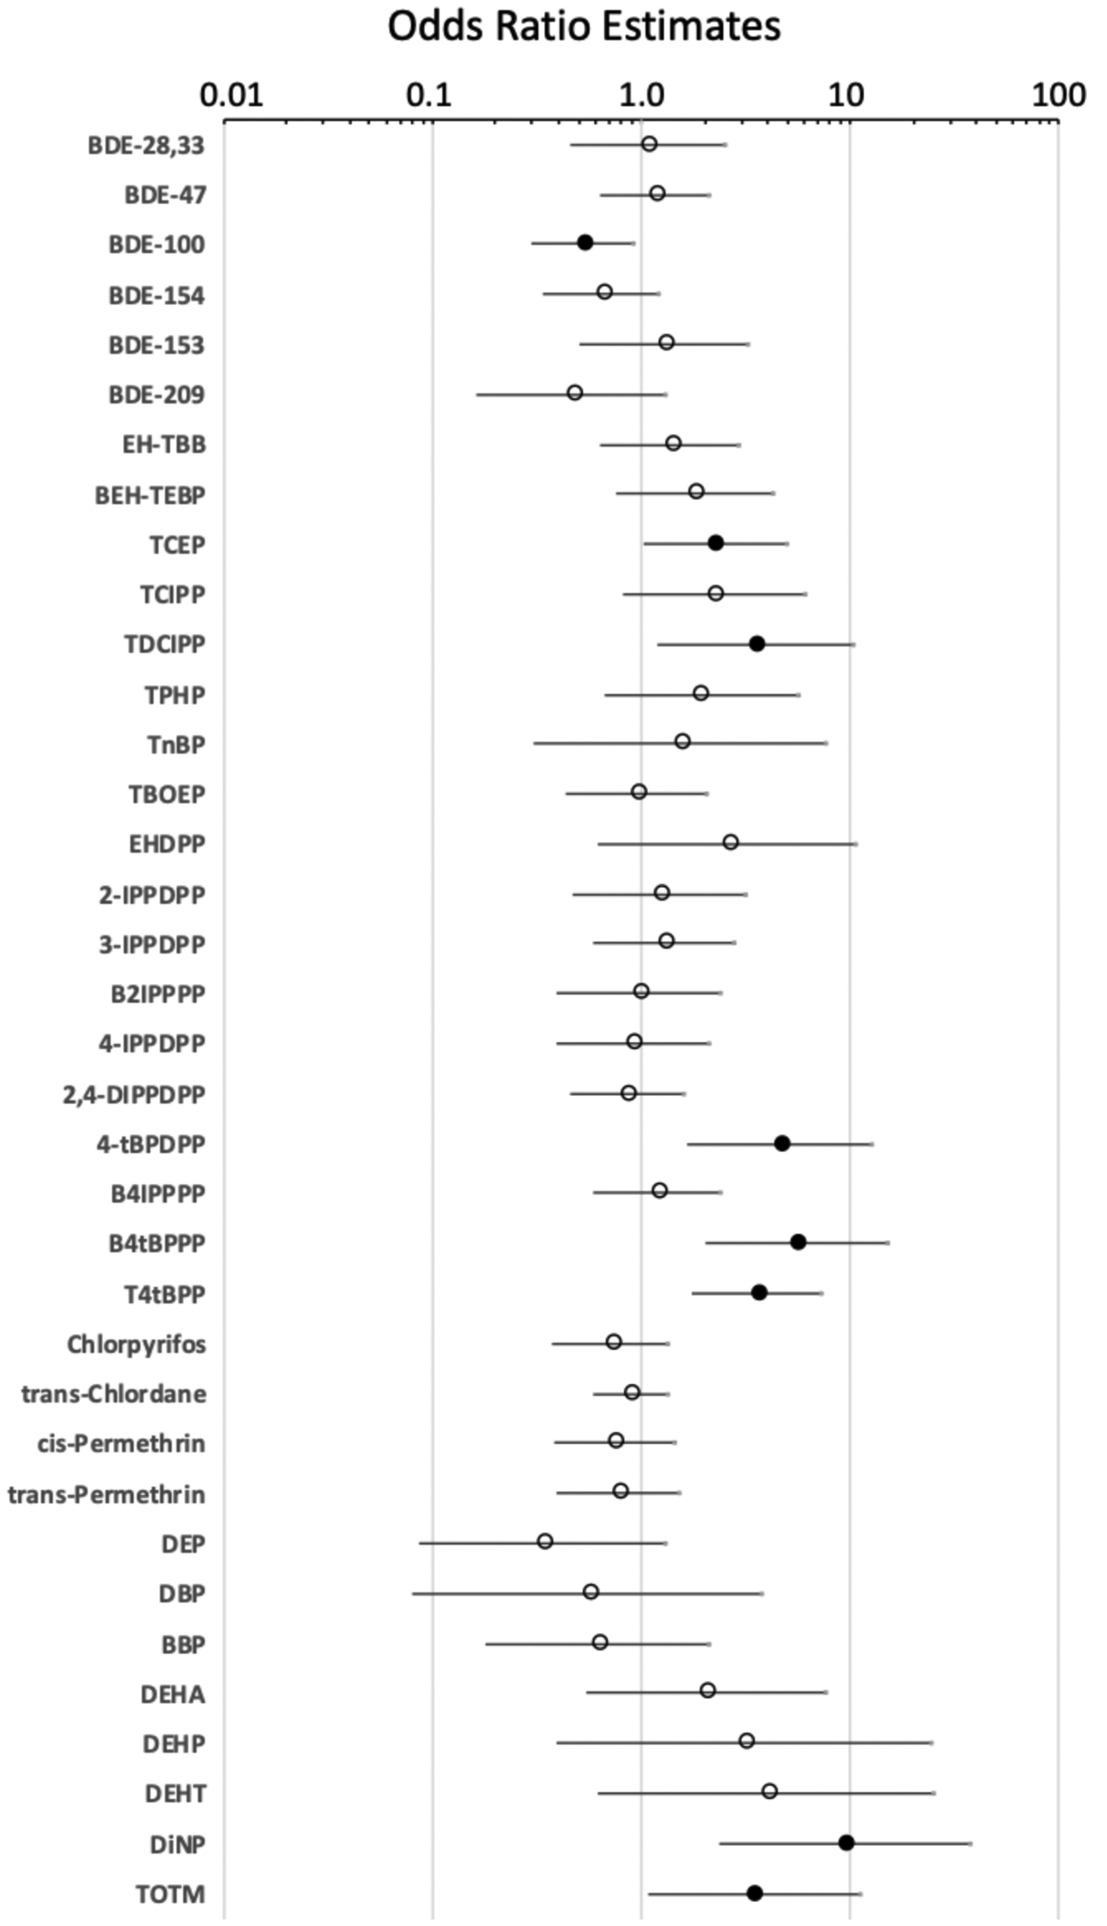
Figure 6.

Targeted chemical concentrations and PTC case status. Results of logistic regression models performed in SAS 9.4 using chemical concentrations in wristband extracts (log-transformed) and PTC case status of participants. Log-transformed chemicals are included as a continuous variable. Filled circles denote significant p < 0.05, and open circles denote p > 0.05. Odds ratios represent the likelihood that a participant will be a PTC case with each log increase in chemical concentrations. Interpretation: DiNP with odds ratio of 9.5 suggests an 8.5-times greater likelihood of having PTC with each log increase in DiNP concentration.
