
Figure 3. From mathematical model to clinical predictions.
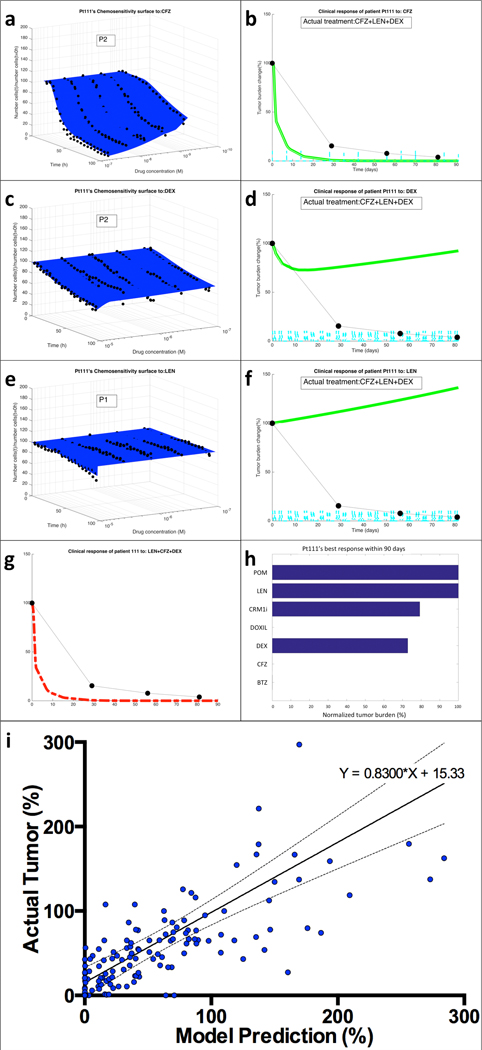
(a) EMMA’s mathematical model fitting of patient Pt111’s MM cells’ ex vivo response to carfilzomib (CFZ) indicates the presence of two “clonal” (no distribution) subpopulations. (b) The simulation of the patient-specific mathematical model using published phase-I trial pharmacokinetic data generates a prediction curve of clinical response. The actual response of the patient, as measured by serum paraprotein, is overlaid as black dots linked by dashed lines. The same process was followed for the two other drugs in the regimen, dexamethasone (DEX) (c,d) and lenalidomide (LEN) (e,f). By combining the effect of the three drugs assuming additivity, EMMA creates the actual clinical prediction of the patient’s estimated response to the therapeutic regimen (g). (h) An analysis of the clinical efficacy (lowest achievable tumor burden, normalized by treatment initiation) shows that carfilzomib, bortezomib and liposomal doxorubicin are the most active agents, with a prediction of 100% tumor reduction, followed by dexamethasone (27% tumor reduction) and CRM1i (21% reduction). Lenalidomide and pomalidomide had no predicted effect. (i) Tumor burden measures from each of the patients in this study (133 in total, detailed in Supplemental Figure 6) were correlated with the corresponding model prediction. The linear regression indicates high correlation between model predictions and actual outcome (equation of regression line Actual=0.8300*Model+15.33, Pearson r=0.5658, P<0.0001).