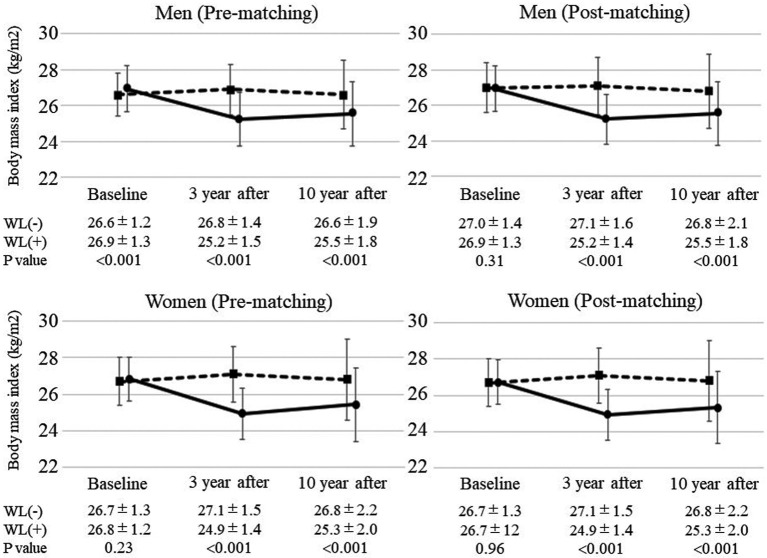
Figure 2.
Changes in the body mass index (BMI) of participants before and after propensity score matching at baseline. The BMI at baseline and after 3 and 10 years was stratified according to weight loss (WL). Solid lines indicate changes in BMI in the WL group, whereas dashed lines indicate changes in BMI in the non-WL group. Data are presented for each sex separately and for participants before and after matching at baseline. Data are the mean±SD.

