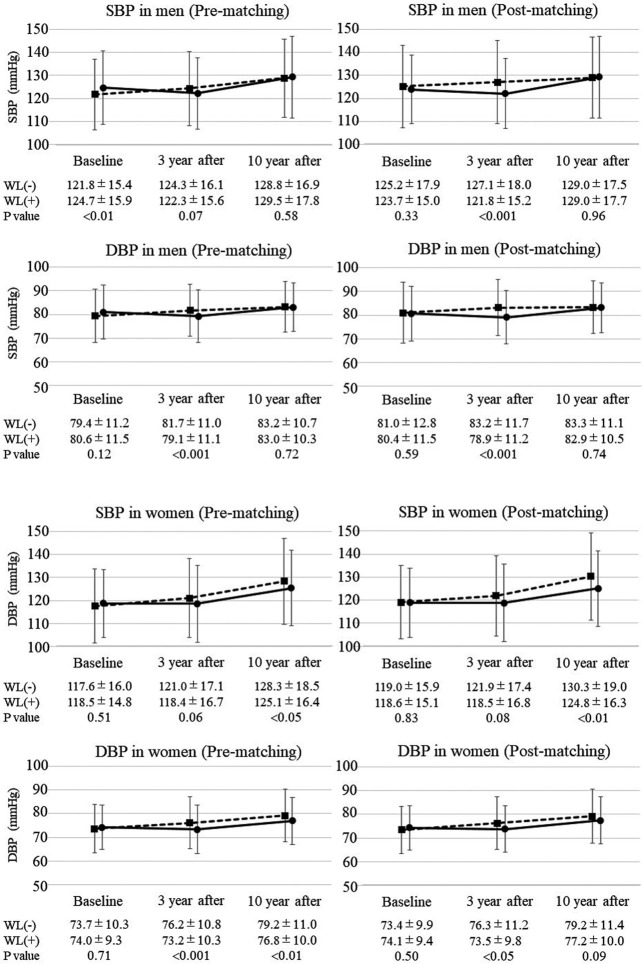
Figure 3.
Changes in systolic and diastolic blood pressure (SBP and DBP, respectively) in participants before and after baseline matching. SBP and DBP at baseline and after 3 and 10 years were stratified according to weight loss (WL). Solid lines indicate changes in blood pressure in the WL group, whereas dashed lines indicate changes in blood pressure in the non-WL group. Data are presented for each sex separately and for participants before and after matching at baseline. Data are the mean±SD.

