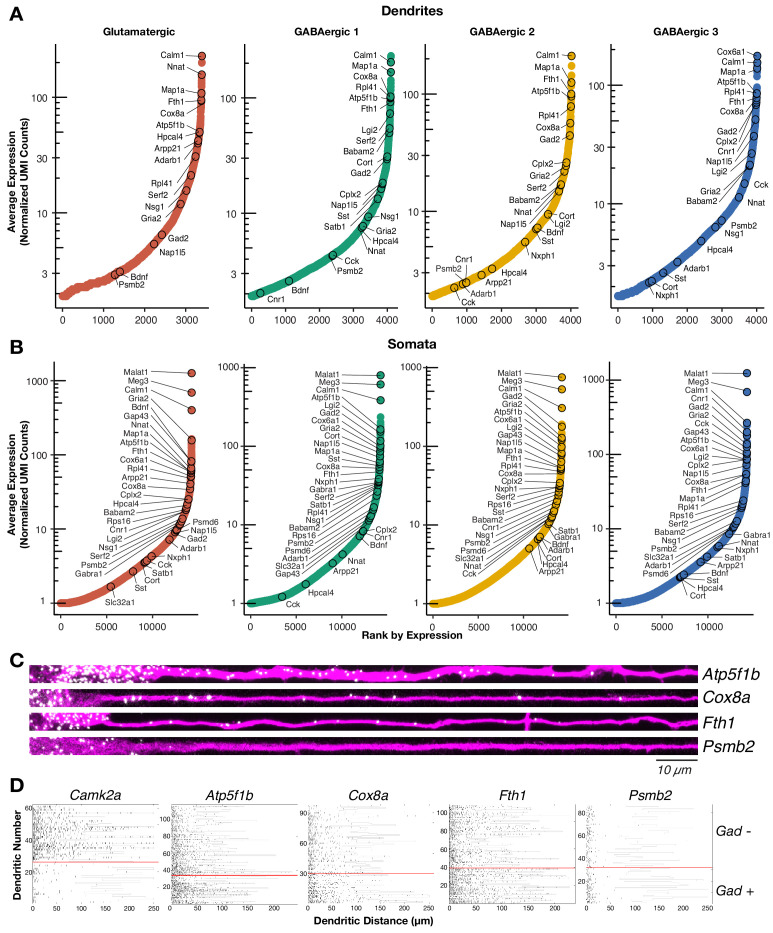
Figure 2. The dendritic transcriptome of GABAergic interneurons.
(A) Plots showing the average normalized unique molecular identifier (UMI) counts of genes detected in the dendrites (≥1.9 molecule per sample on average) of the indicated cell types. X-axis shows genes ranked according to their expression from lowest to highest. Some genes are indicated by name. N = glutamatergic (11), GABAergic 1 (36), GABAergic 2 (30), and GABAergic 3 (18). (B) Same as A but for somatic samples. N = glutamatergic (95), GABAergic 1 (103), GABAergic 2 (82), and GABAergic 3 (65). (C) smFISH for indicated mRNAs (in white) observed in GABAergic dendrites immunolabeled with an anti-Map2 antibody (magenta). GABAergic identity was determined by smFISH Gad1/2 as seen in Figure 2—figure supplement 1A. Scale bar = 10 µm. (D) Raster plot showing smFISH dendritic detection pattern over a large number of dendrites. Dendrites of both excitatory and inhibitory cells were straightened from the same images, sorted according to the expression of Gad1/2 (positive below red line, negative above red line) and the gene of interest channel displayed, after automated peak detection, as a raster plot.


