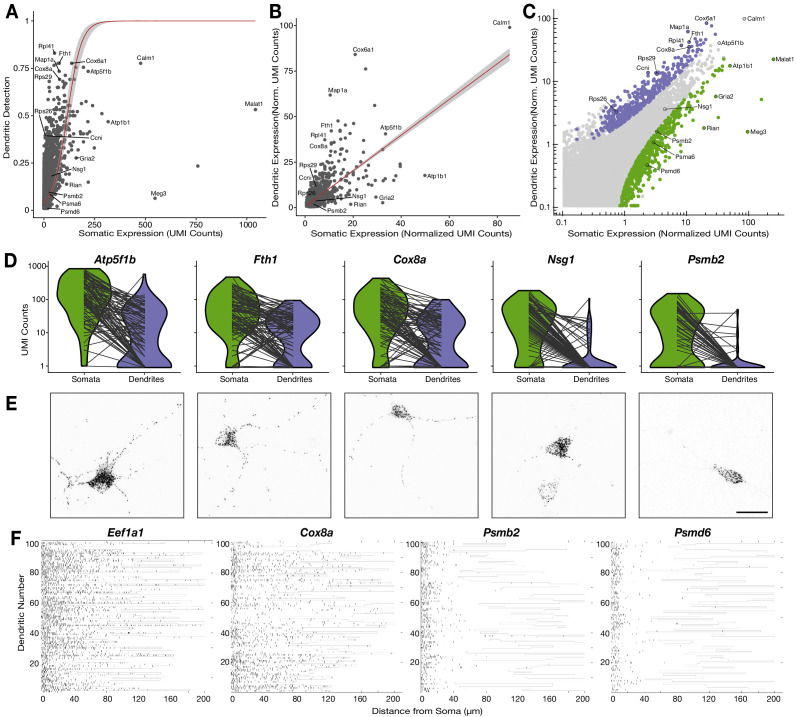
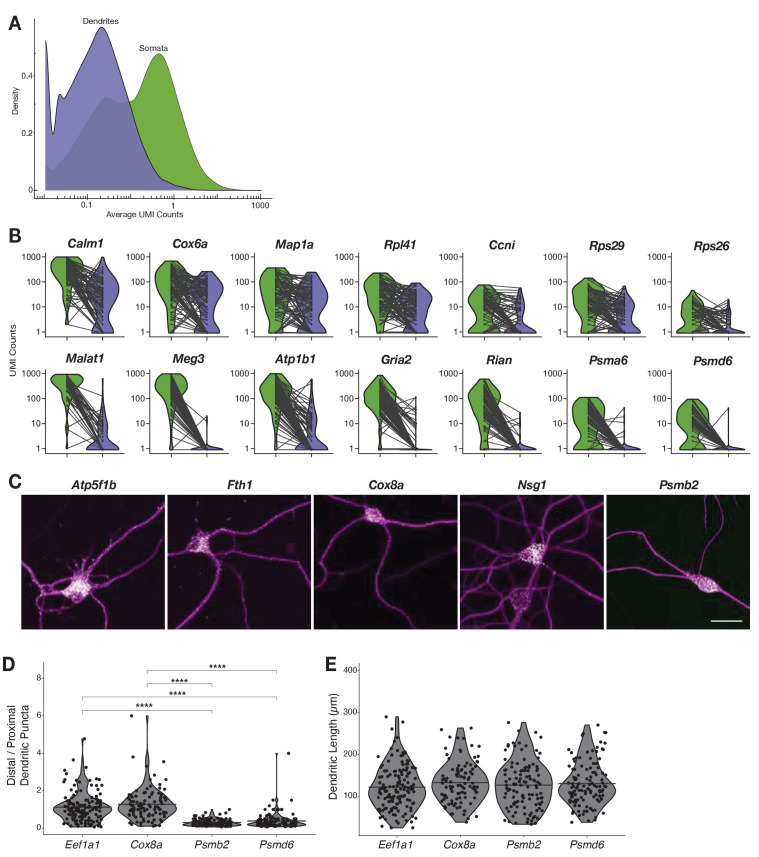
Figure 4. Relationship between the somatic and dendritic transcriptomes of single neurons.
(A) Scatterplot showing the relationship between somatic abundance (in average unique molecular identifier [UMI] counts) and the fraction of samples in which an mRNA species is detected in the dendrites. A logistic regression model revealed a significant correlation (p=1.29 × 10⁻⁶, McFadden’s Pseudo R2 = 0.33). Gray area indicates the 95% confidence interval. Some genes discussed in the text are indicated by name. (B) Correlation between somatic and dendritic expression for genes expressed in at least 20% of dendritic samples. Red curve shows a linear regression model (p=2 × 10⁻¹⁶, R2 = 0.50). Some genes discussed in the text are indicated by name. Gray area indicates the 95% confidence interval. (C) Scatterplot showing the results of paired differential expression analysis using a Poisson generalized linear model. Colored dots indicate statistically significant genes (adjusted p<0.05) in somata (green) or dendrites (purple); some significant genes are indicated by name. (D) Violin plots showing the raw counts in somata and dendrites of gene examples. Lines between violins indicate the paired values of soma and dendrites from the same neuron. (E) FISH validations for genes indicated in D. The abundance and distribution of mRNAs detected (black) are shown. Neurons were identified by anti-Map2 immunolabeling (see images in Figure 4—figure supplement 1C). Scale bar = 25 µm. (F) Raster plot showing the cell-to cell variability of mRNA localization as determined by smFISH, for candidate dendritically enriched (Eef1a1, Cox8a) and dendritically de-enriched (Psmb2, Psmd6) mRNAs. One dendrite was chosen per cell, straightened, and the profile converted via peak detection into a raster plot (displayed from soma/proximal dendrite to distal dendrite, from left to right).


