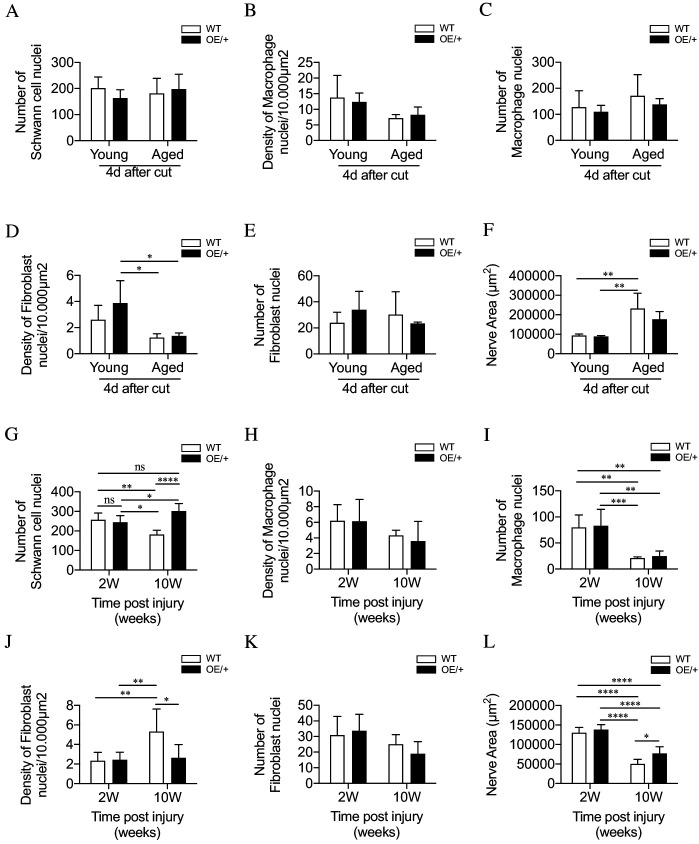
Figure 6. Cell number and nerve size in injured WT and c-Jun OE/+ nerves Cell nuclei were counted in whole transverse profiles of the tibial nerve, 5 mm from the injury site, using the electron microscope.
(A) Schwann cell numbers in young and aged WT and c-Jun OE/+ nerves. (B) Macrophage density and (C) number in young and aged WT and c-Jun OE/+ nerves. (D) Fibroblast density and (E) number in young and aged WT and c-Jun OE/+ nerves: *p<0.05. (F) Whole transverse profiles of the tibial nerve were measured for the nerve area of young and aged WT and c-Jun OE/+ nerves; **p<0.005. For counts in A-F, n = 4 for each condition. (G) Schwann cell numbers in 2- and 10-week cut nerves of WT and c-Jun OE/+ mice; *p<0.05, **p<0.005, ****p<0.0001. (H) Macrophage density and (I) number in 2- and 10-week cut nerves of WT and c-Jun OE/+ mice; **p<0.005, ***p<0.001. (J) Fibroblast density and (K) number in 2- and 10-week cut nerves of WT and c-Jun OE/+ mice; *p<0.05, **p<0.005. (L) Whole transverse profiles of the tibial nerve were measured for the nerve area of 2- and 10-week cut nerves of WT and c-Jun OE/+ mice; *p<0.05, ****p<0.0001. For counts in G-L, 2-week WT and c-Jun OE/+ n = 7, 10-week WT and c-Jun OE/+ n = 5. All number data represented as means ± SEM analyzed by two-way ANOVA with Tukey’s multiple comparison test.

