. 2021 Jan 21;10:e63088. doi: 10.7554/eLife.63088

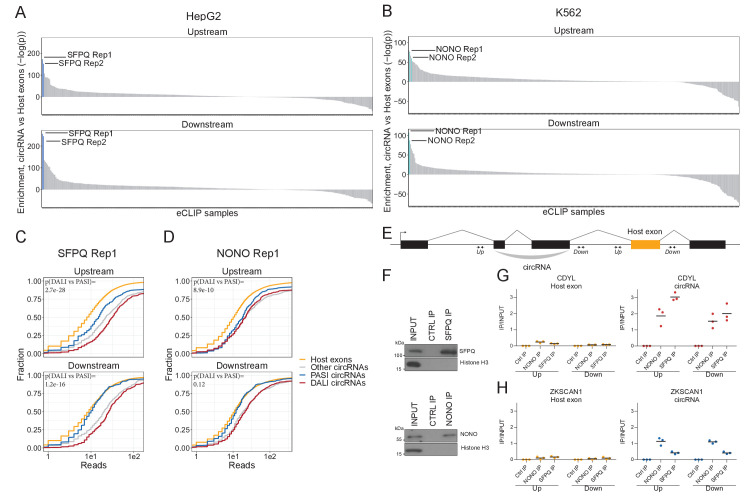
Figure 2. SFPQ and NONO show enriched binding in the flanking regions of DALI circRNAs.

(A–B) Barplot showing enrichment/depletion of eCLIP signal (see Supplementary file 2) in the vicinity of circRNAs (+/- 2000 nt) compared to host exons (+/- 2000 nt) as determined by Wilcoxon rank-sum tests for HepG2 (A) and K562 (B) eCLIP samples. (C–D) Cumulative plots of SFPQ (C) and NONO (D) eCLIP read distribution upstream and downstream of circRNA subgroups and host exons as denoted. (E) Schematic showing localization of primers (+/- 2000 nt) for targeting either upstream (up) or downstream (down) intronic regions of splice sites in respect to circRNA exons or host exon. (F) Western blotting of immunoprecipitated (IP), endogenous SFPQ or NONO from nuclear fractions of HepG2 cells with Histone H3 as a loading control. (G–H) RT-qPCR of intronic regions flanking a downstream host gene exon (left facet) or flanking the circRNA producing exon(s) (right facet) of CDYL (G) and ZKSCAN1 (H) upon RNA IP of endogenous SFPQ or NONO from nuclear fractions of HepG2 cells. The relative expression of immunoprecipitate (IP)/input is plotted. Data for three biological replicates are shown.

Figure 2.

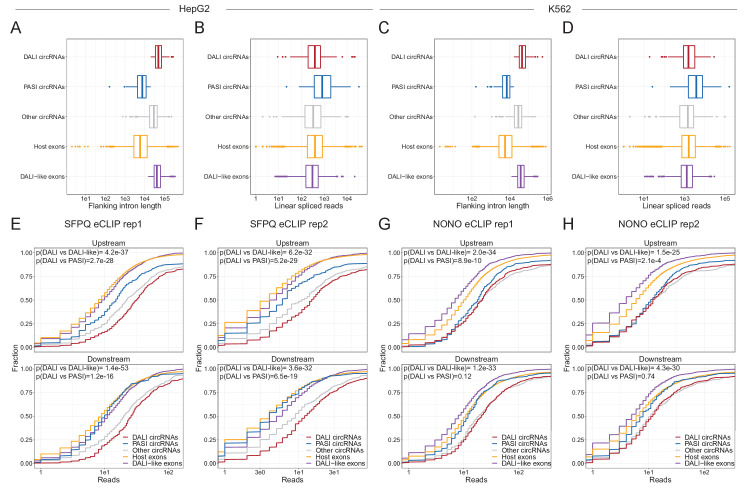
Figure 2—figure supplement 1. SFPQ and NONO enriched on circRNA flanking introns.

Figure 2—figure supplement 1.

(A–D) For HepG2 (A and B) and K562 (C and D), boxplots showing the distribution of flanking intron length (A and C) or linear spliced reads (B and D) for DALI circRNAs (red), PASI circRNAs (blue), other circRNAs (gray), host exons, that is all other annotated exons from the circRNA-producing loci (orange), and DALI-like circRNAs, that is exon-pairs from annotated genes sampled to resemble DALI circRNAs based on flanking intron lengths and linear spliced reads (purple). (E–H) Boxplots of reads from SFPQ eCLIP rep1 (F), SFPQ eCLIP rep2 (G), NONO eCLIP rep1 (H), and NONO eCLIP rep2 associated with each subgroup in HepG2 cells (F–G) and K562 cells (H–I) stratified by upstream (upper facets) and downstream (lower facets) aligned reads. p-Values are calculated using Wilcoxon rank-sum tests.
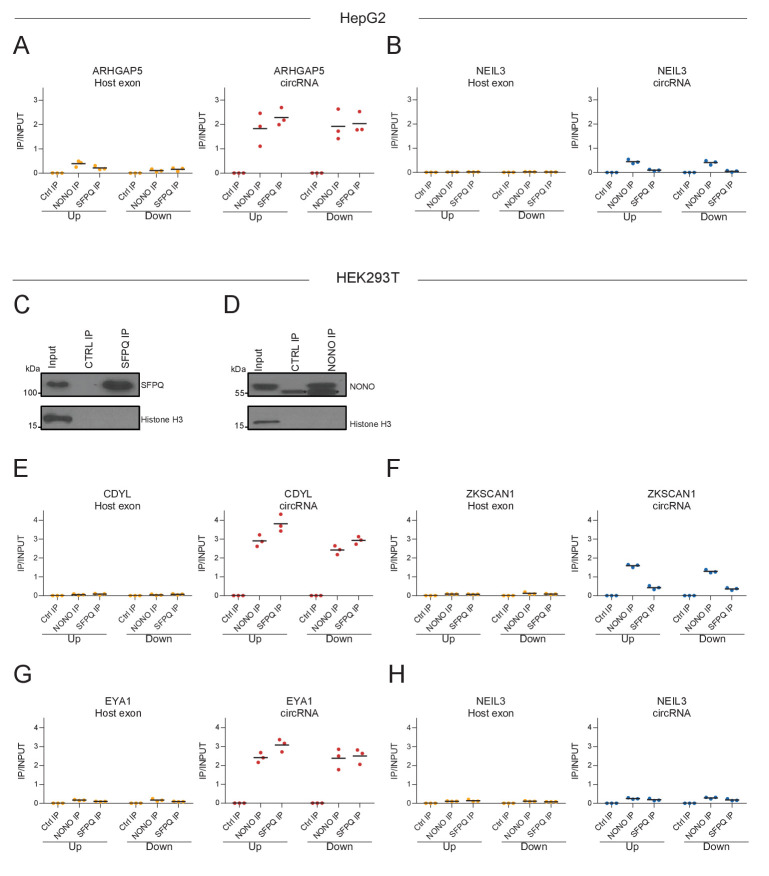
Figure 2—figure supplement 2. RNA immunoprecipitation of SFPQ and NONO confirms enrichment.

Figure 2—figure supplement 2.

(A–B) As in Figure 1G–H, RT-qPCR on denoted intronic regions in ARHGAP5 (A) and NEIL3 (B) transcripts upon RNA IP of endogenous SFPQ or NONO from nuclear fractions of HepG2 cells. (C–D) Western blotting of endogenous immunoprecipitated (IP) SFPQ (C) or NONO (D) from nuclear fractions of HEK293T cells with Histone H3 as a loading control. Asterisks denote bands derived from the IP antibody. (E–H) As in A-B but using HEK293T cells and with RT-qPCR on CDYL (C), ZKSCAN1 (D), EYA (E), and NEIL3 (F). Data for three biological replicates are shown.