. 2021 Jan 21;10:e63088. doi: 10.7554/eLife.63088

Figure 5. SFPQ depletion activates intronic polyA signal and premature termination.

(A) Volcano plot showing deregulated PAS usage as measured by quantseq upon NONO and SFPQ depletion in HEK293T cells. PAS signals are color-coded by their genic origin; intronic (dark blue), exonic (light blue), or ambiguous (gray). (B) Plot showing the cumulative fraction of PASs as a function of relative genic position stratified by genic origin (ambiguous, exonic or intronic, vertical facets) and color-coded by whether the PAS is significantly up (red) or downregulated (blue) upon SFPQ knockdown. (C) Schematic representation of the DENND1A exon 8–9 locus with alternative exon (green) and putative PAS element (purple). Below, merged quantseq coverage from each experiment. (D) RT-qPCR on input and oligo-dT purified RNA from control and SFPQ-depleted HEK293T cells using amplicons specific for GAPDH mRNA (positive control), circZKSCAN1 (negative control), and the alternative SFPQ-activated exon. Values reflect ratios between oligo-dT purified and input quantities. Data for two biological replicates are shown. (E) Venn diagrams showing the number of unique introns with co-occurring upregulation of PAS and upregulated alternative splicing. The number of expressed introns without any evidence of enriched PASs or alternative splicing is denoted below the diagram. P-values are calculated by Fisher’s exact test. (F–G) Schematic showing the outline of the analysis (upper panel): For each circRNA, the locus spanning from the promoter to the circRNA splice donor was interrogated for the presence of quantseq PASs (F) or exon inclusion (G). Barplot (lower panel) showing the fraction of upregulated and downregulated circRNAs upon SFPQ depletion in HEK293T cells with evidence of a concomitant upregulated upstream PAS (F) or an upstream exon inclusion event (G). Numbers indicate the total number of circRNAs in each group. p-Values are calculated by Fisher’s exact test.

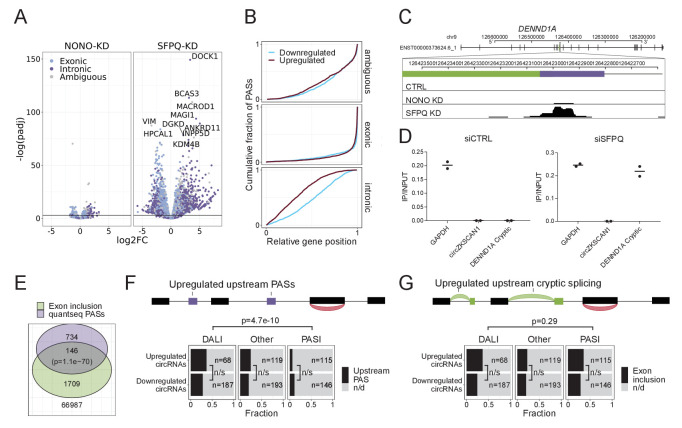
Figure 5.

Figure 5—figure supplement 1. Quantseq analysis.

Figure 5—figure supplement 1.

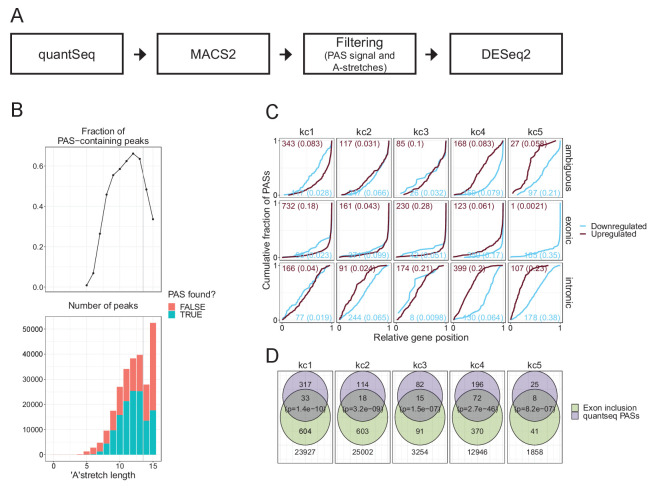
(A) Schematics depicting the quantseq workflow (B) Top: characterization of the fraction of PAS-containing peaks, where PAS is defined as AAUAAA or AUUAAA, as a function of longest oligo-A stretch identified in peak +/- 50 nt flanking region. Bottom: Total number of peaks identified with (green) or without (orange) PAS as a function of longest A-stretch. (C) Venn diagrams (as in Figure 5E) showing overlapping quantseq PASs and cryptic splicing but stratified into the five kmeans clusters. (D) Relative quantseq PAS position within annotated genes (as in Figure 5B) but stratified by kmeans clusters. Numbers denote the number of peaks in each group and the fraction of genes with significant deregulated peaks in parenthesis.
Figure 5—figure supplement 2. U1 snRNA abundance upon SFPQ knockdown.

Figure 5—figure supplement 2.

(A) PAGE northern blot on U1 levels (upper panel) upon CTRL or SFPQ depletion in HepG2 cells using two different siRNA designs as denoted. 7SK (lower panel) is used as a loading control. (B) Abundance of U1 snRNA measured by RT-qPCR relative to GAPDH. Triangles and circles, as denoted, represent the two different siRNA designs. (C–D) as in A-B, but using HEK293T cells.
Figure 5—figure supplement 3. circRNAs in kmeans clusters.

Figure 5—figure supplement 3.

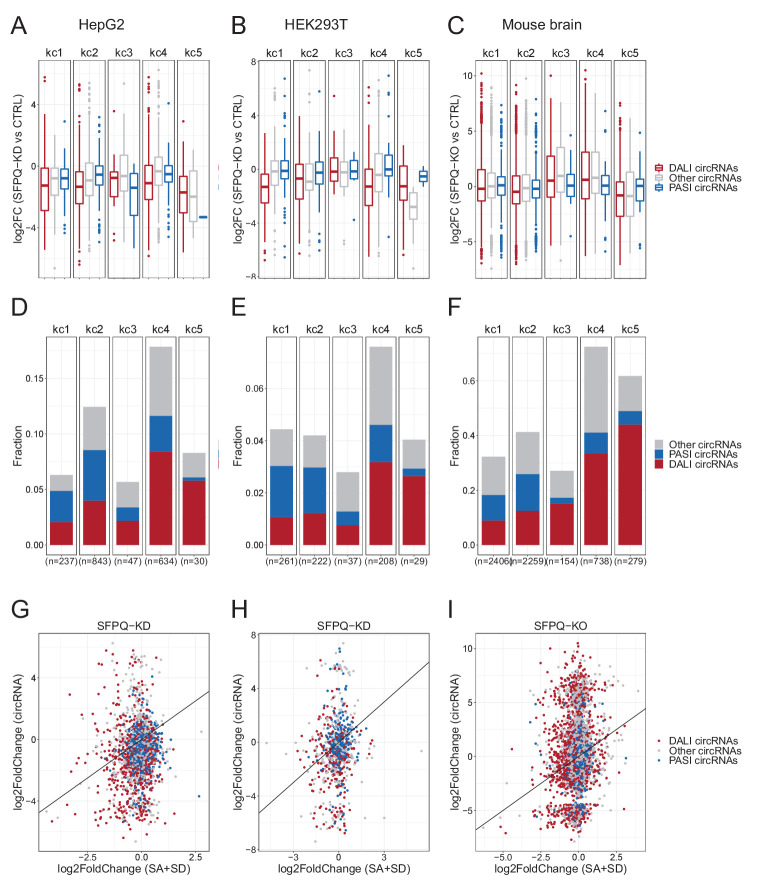
(A–C) For each kmean cluster, boxplots showing the log2FoldChange of circRNAs expression upon SFPQ depletion in HepG2 (A), HEK293T (B) cells, and mouse brain (C) stratified by circRNAs subgroup. (D–F) Barplot of numbers and fraction of circRNAs in each kmean cluster in HepG2 (D), HEK293T (E) cells, and mouse brain (F). The fraction is determined by the number of genes hosting circRNAs relative to the total number of genes in each cluster. (G–I) Scatterplot relating the circRNA deregulation (log2FC) with the deregulation of host-gene linear splicing for HepG2 (G), HEK293T (H) cells, and mouse brain (I) colorcoded by circRNAs subgroup. The diagonal line represents the perfect correlation.