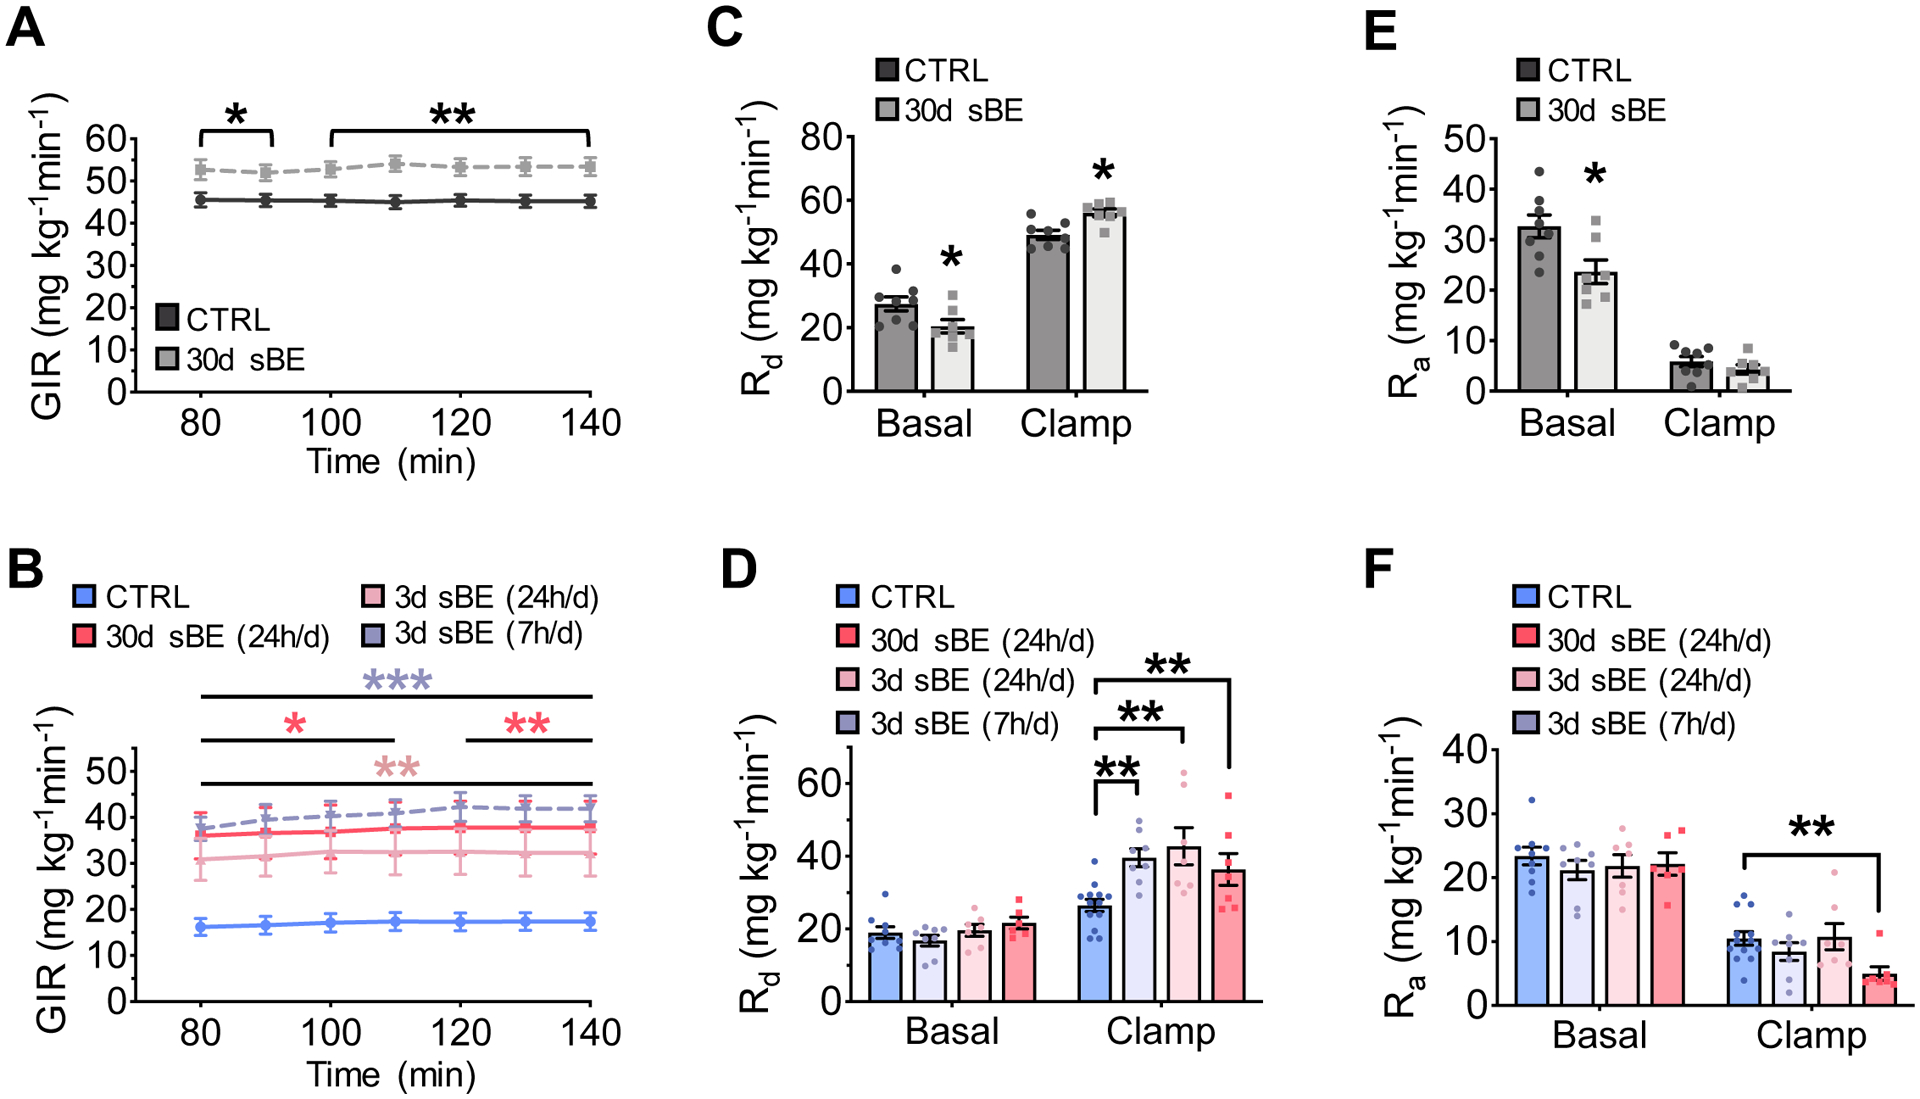
Figure 2. sBE exposure enhances insulin sensitivity.

(A–F) Euglycemic-hyperinsulinemic clamps were performed on NCD and HFD mice exposed to sBE following a 6 h fast.
(A) Glucose infusion rate (GIR) in NCD mice exposed to 30 days of continuous sBE (n ≥ 7 mice/group).
(B) GIR in HFD mice exposed to sBE continuously (24 h/day) for 30 days, continuously (24 h/day) for 3 days, or for 7 h/day for a total of 3 days (n ≥ 7mice/group).
(C) Rate of glucose disposal (Rd) in NCD mice (n ≥ 7mice/group).
(D) Rd in HFD mice (n ≥ 7mice/group).
(E) Rate of glucose appearance (Ra) in NCD mice (n ≥ 7mice/group).
(F) Ra in HFD mice (n ≥ 7mice/group).
Data presented as mean ± SEM. NCD mice data analyzed by two-tailed, unpaired Student’s t-test. HFD mice data analyzed by one-way ANOVA with Dunnett’s correction for multiple comparisons. *P < 0.05, **P < 0.01, ***P < 0.001.
