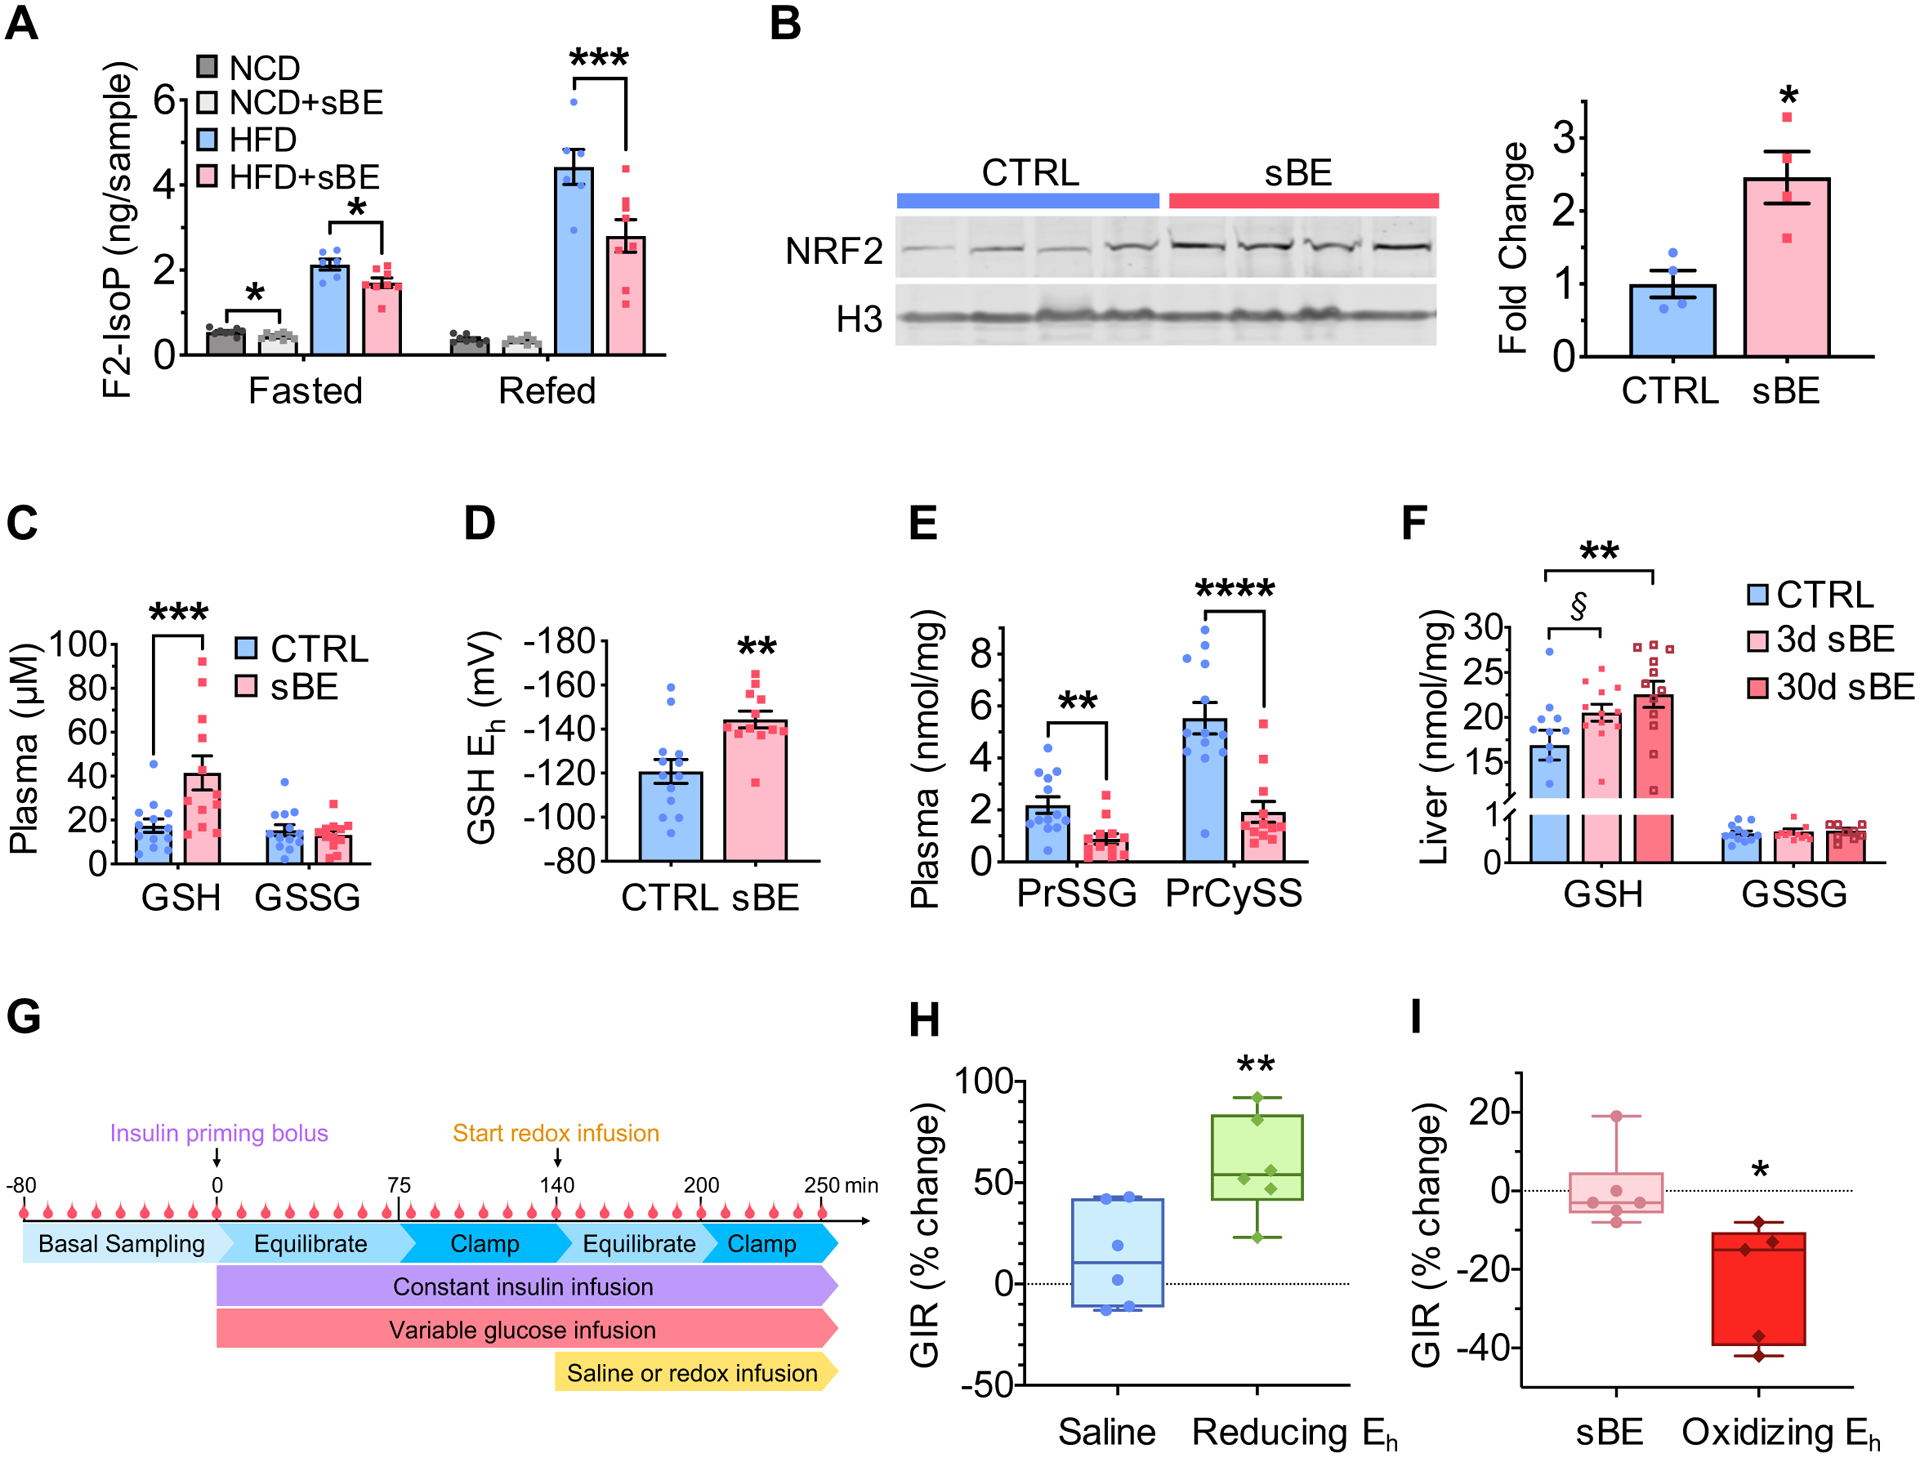
Figure 4. sBE exposure alters the systemic redox state to enhance the insulin response.

(A) Plasma F2-isoprostanes in 3 day sBE-exposed NCD- and HFD mice fasted for 16 h and refed for 4 h (n = 8 mice/group).
(B) Western blot image (left) and quantification (right) of 3-day sBE-exposed HFD mouse liver nuclear fractions NRF2 normalized to histone 3 (H3) (n = 4 mice/group).
(C–E) Measurements of analytes in plasma collected from control HFD mice and 3 day sBE-exposed HFD mice.
(C) Plasma concentration of glutathione (GSH) and glutathione disulfide (GSSG) (n ≥ 12 mice/group).
(D) Half-cell reduction potential of GSH in plasma (n ≥ 12 mice/group).
(E) Protein glutathionylation (PrSSG) and protein cysteinylation (PrCySS) in plasma (n ≥ 12 mice/group).
(F) Livers were collected from 3 day and 30 day sBE-exposed HFD mice and assessed for GSH and GSSG presented as a concentration (nmol per mg of protein) (n ≥ 10 mice/group). §P = 0.07. **P < 0.01
(G) Schematic of euglycemic-hyperinsulinemic clamp procedure with the infusion of a reducing or oxidizing redox solution.
(H–I) Euglycemic-hyperinsulinemic clamp paired studies performed on HFD mice.
(H) Percent change in glucose infusion rate (GIR) of untreated HFD mice basally clamped at 150 mg/dL plasma glucose and then re-clamped at this concentration during an infusion of saline or a reducing solution of GSH/GSSG (reducing Eh) (Saline infusion, n = 6 mice; Reducing Eh infusion, n = 6 mice).
(I) Percent change in GIR from 3 day sBE-exposed HFD mice basally clamped at 150 mg/dL plasma glucose and then re-clamped at this concentration during an infusion of saline or an oxidizing solution of GSH/GSSG (oxidizing Eh) (sBE-exposed with saline infusion, n ≥ 5 mice; sBE-exposed with oxidizing Eh infusion, n ≥ 5 mice).
Data presented as mean ± SEM. Data panels (A) and (F) analyzed by with Sidak’s multiple comparison t-tests. Data panels (B–E) analyzed by two-tailed, unpaired Student’s t-test. Data panels (H) and (I) analyzed by two-tailed, paired Student’s t-test. *P < 0.05, **P < 0.01, ***P < 0.001, ****P < 0.0001.
