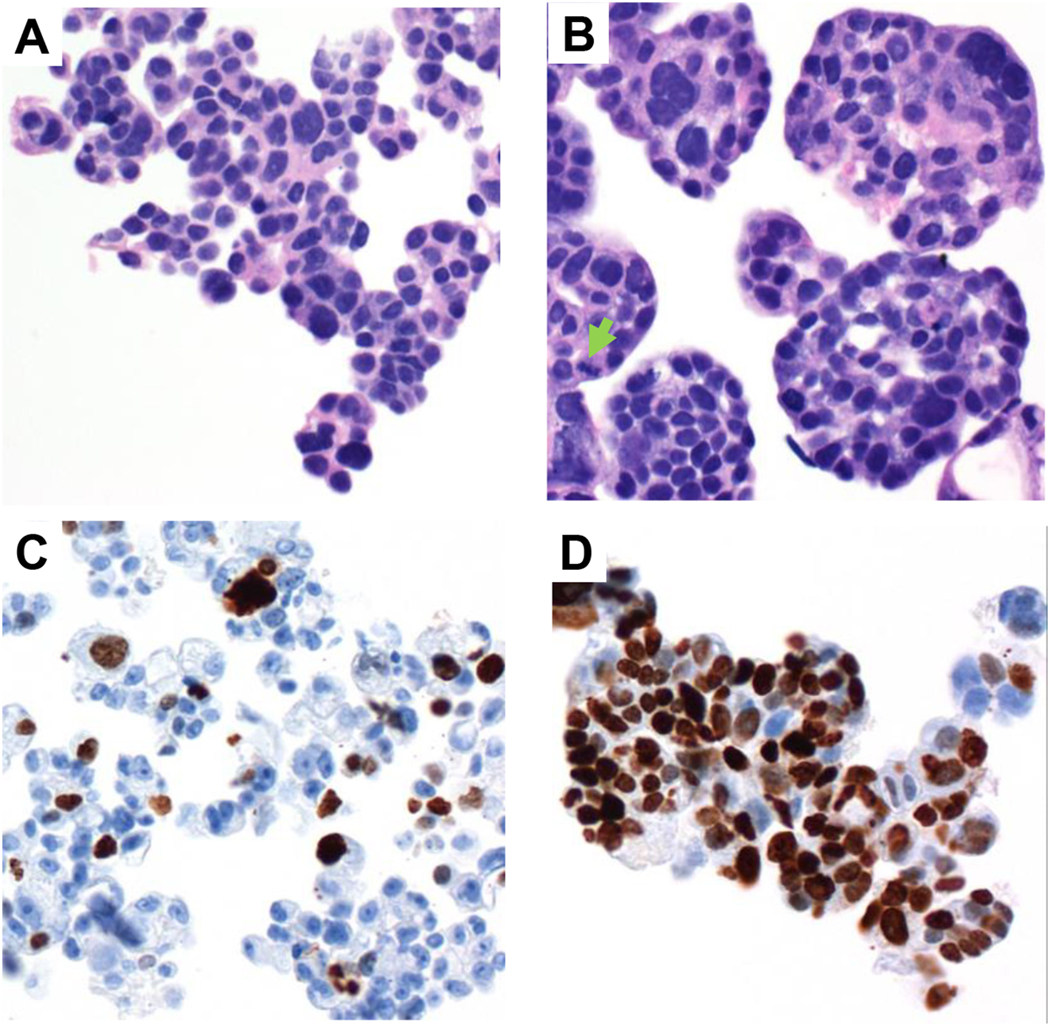
Fig. 2.
Characterization of organoid by H&E (A–B) and Ki67 (C–D). A represents MCS (day 0) while B depicts organoids on day 6. Variable numbers of non-viable appearing cells were seen in both MCS and day 6 specimens, but day 6 specimens showed larger cell groupings with frequently-seen mitotic figures (arrow). C represents Ki67 staining for MCS (day 0) while D represents organoids on day 6. Ki67 index increased on average by 3.5-fold. A–B: 400×, C–D: 200×.

