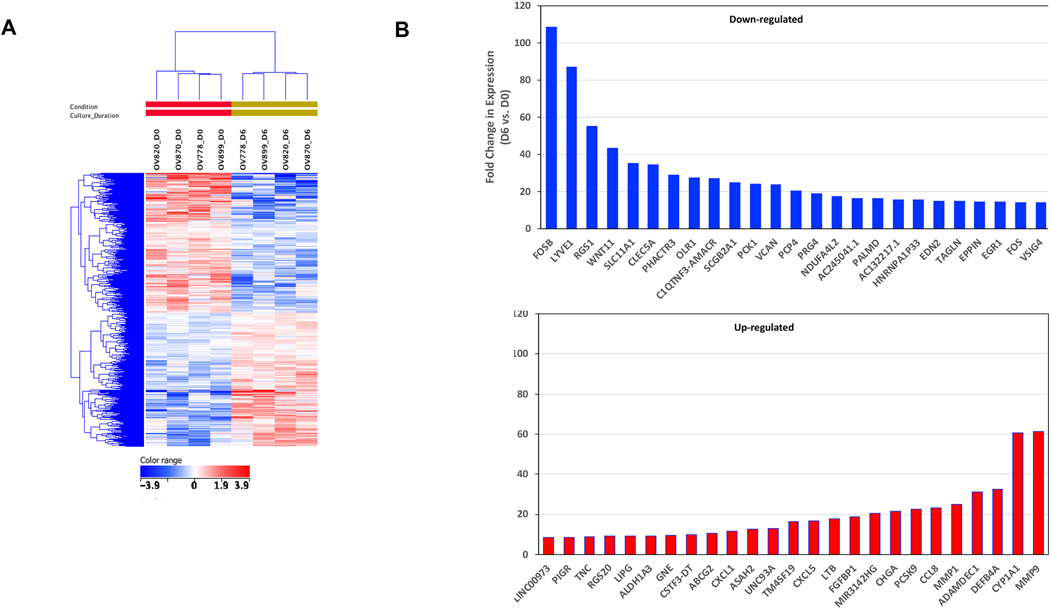
Fig. 3.
Molecular characterization of organoid culture. A: Hierarchical clustering and heatmap of 1584 statistically significant differentially-expressed genes (DEG) in day 6 organoids compared to MCS (day 0); p < 0.05, >1× fold change. B: Fifty most highly DEGs (25 increased and decreased) in OVCA organoids after 6 days in organoid culture (MCS vs. day 6, paired t-test, p < 0.05). Expression changes are depicted as red or blue bars, respectively.

