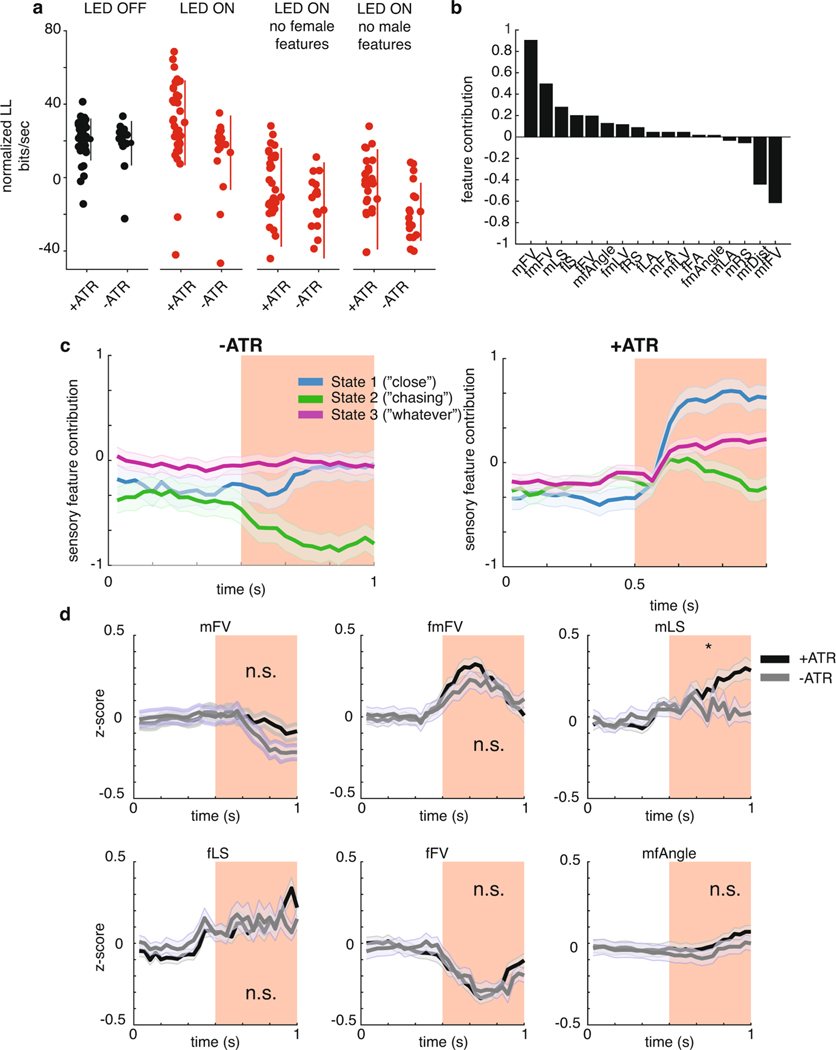
Extended Data Fig. 9 |. Bias toward close state is due to the altered use of feedback cues.
a, Predictive performance is not significantly different between light ON and light OFF conditions for both ATR-fed (n=41, p=0.08) and ATR-free animals (n=28, p=0.46). Performance suffers without male (+ATR p=4e-12, −ATR p=1e-9) or female feedback cues (+ATR p=1e-10, −ATR p=1e-9), suggesting these state-specific features are needed to predict animal behavior. Dots represent individual flies, center line is mean and lines are +/− SD. All statistical tests are Mann-Whitney U-test. b, The similarity between each feedback cue and the filters for the ‘close’ state are subtracted by the similarity of that feedback cue to the filters for the ‘chasing’ state during LED activation of ATR-fed pIP10 flies. This reveals song patterning is more similar to the ‘close’ state than the ‘chasing’ state for most feedback cues. c, Animals that were not fed ATR (n=28) do not show a change in the contribution of the feedback cues to being in a given state, while animals that are fed ATR (n=41) do show a change in feedback cue contribution. Shaded area is SRM. d, Most aspects of the animal trajectory do not differ in response to red light when males are either fed (black, n=41) or not fed (gray, n=28) ATR food. Plotted are the six strongest contributors from (b). p-values are p=0.056 for mFV, p=0.11 for fmFV, 9.7e-5 for mLS, p=0.64 for fLS, p=0.67 for fFV, p=0.009 for mfAngle Mann-Whitney U-test, significance at p = 0.05 corrected to p = 0.0083 by Bonferroni. * represents p < 0.0083, n.s. p > 0.008. Shaded area is SEM.

