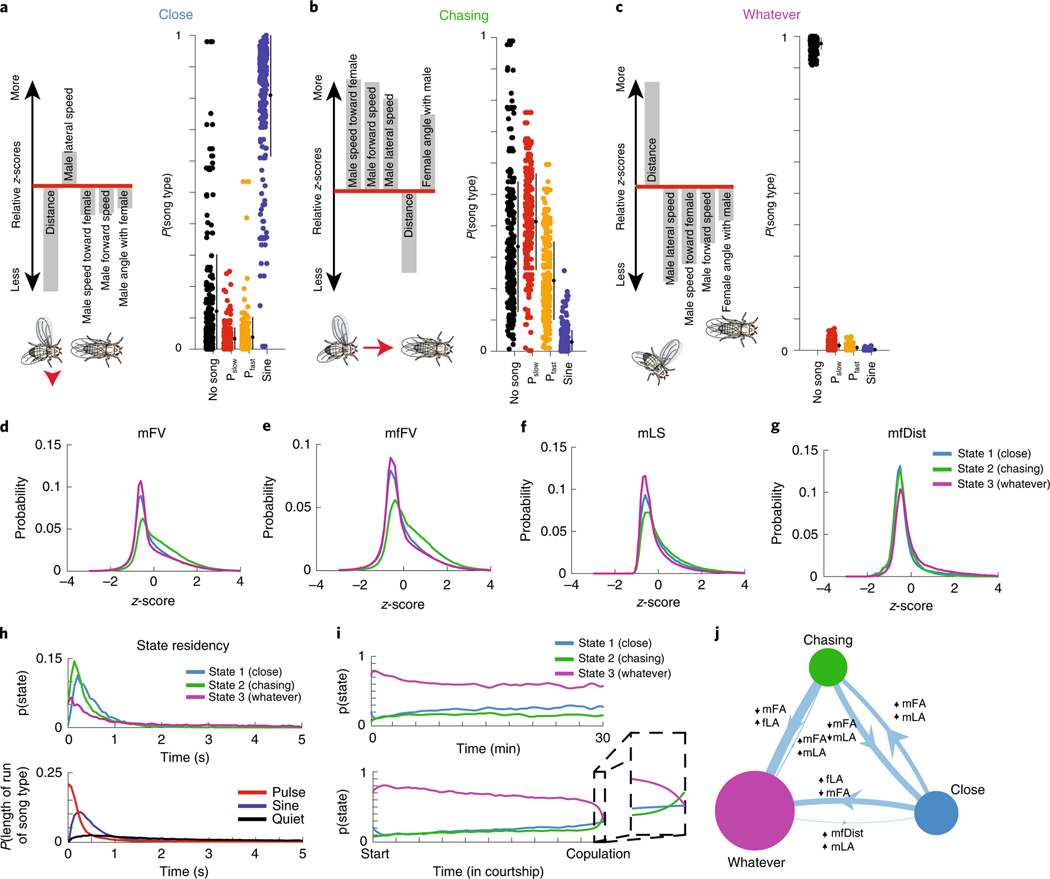
Fig. 2 |. Three sensorimotor strategies.
a–c, Left: the five feedback cues that are most different from the mean when the animal is in the Close (a), Chasing (b) or Whatever (c) state (see Methods for details on z-scoring). Illustration of flies is a representation of each state according to these feedback cues. Right: the probability of observing each type of song when the animal is in that state. Filled circles represent individual animals (n = 276 animals, small black circles with lines are the mean ± s.d.). d–g, Distributions of values (z-scored, see Methods) for four of the feedback cues (see Fig. 1b) and for each state. Although a state may have features that are larger or smaller than average, the distributions are highly overlapping (the key in g also applies to d–f). h, Top: the dwell times of the Close, Chasing and Whatever states across all of the data (including both training and validation sets). Bottom: the dwell times of sine trains, pulse trains and stretches of no song (see Fig. 1a for definition of song modes; Pfast and Pslow are grouped together here) across all of the data are dissimilar from the dwell times of the states with which they are most associated. Data from all 276 animals. i, Top: the mean probability across flies of being in each state fluctuated only slightly over time when aligned to absolute time (bottom) or the time of copulation (bottom). Immediately before copulation, there was a slight increased probability of being in the Chasing state (bottom, zoomed-in area). Data are from all 276 animals. j, Areas of circles represent the mean probability of being in each state and the width of each line represents the fixed probability of transitioning from one state to another. The filters that best predicted transitioning between states (and modify the transition probabilities) label each line, with the up arrow representing feedback cues that increase the probability and the down arrow representing feedback cues that decrease the probability.

