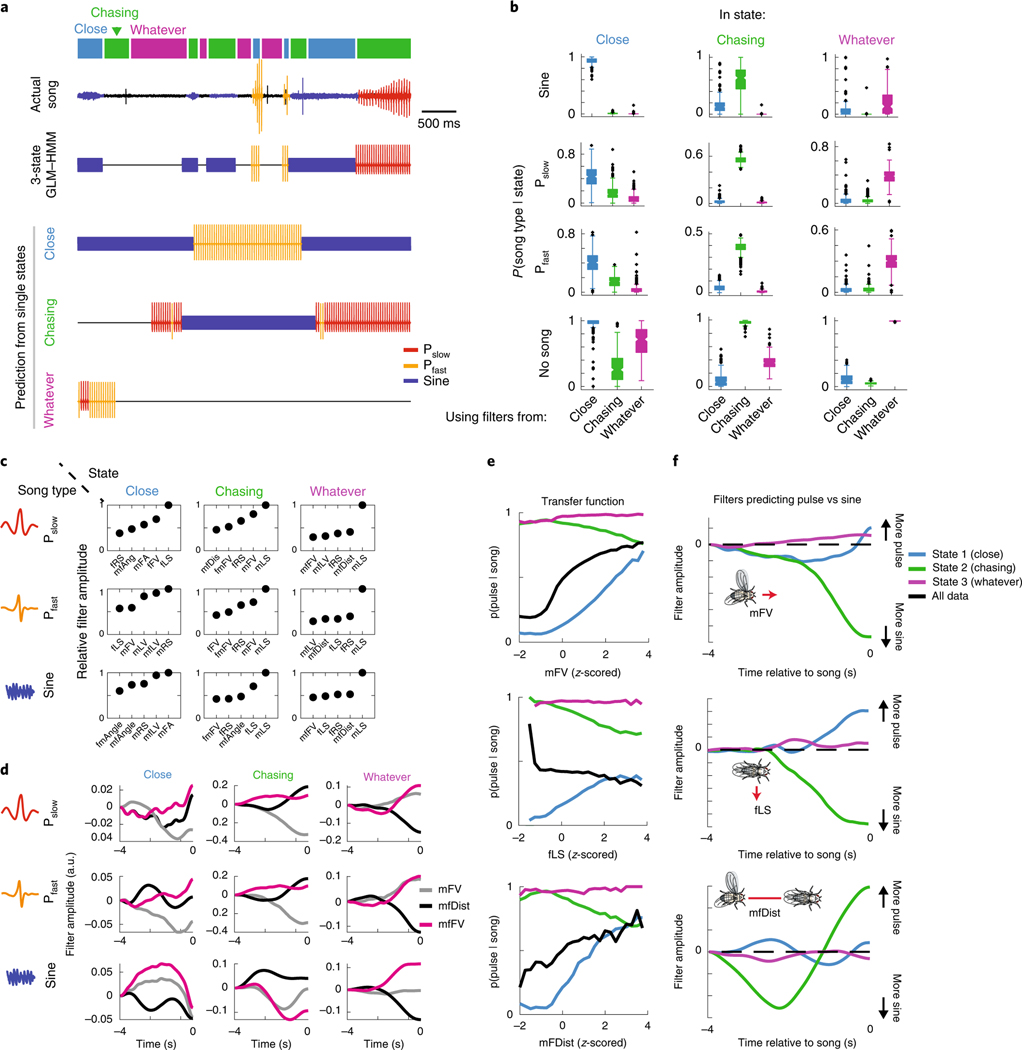
Fig. 3 |. Internal states are defined by distinct mappings between feedback cues and song behavior.
a, A stretch of 500 ms of song production from the natural courtship dataset, with the prediction of states indicated above in colored squares. The prediction of the full GLM–HMM model (third row) is very different from the prediction if we assume that the animal is always in the Close state, Chasing state or Whatever state. The output using the song prediction filters from only that state is illustrated in the lower three rows. b, The conditional probability (across all data, n = 276 animals, error bars represent the s.e.m.) of observing a song mode in each state (predicted by the full three-state GLM–HMM), but using output filters from only one of the states. Conditional probability of the appropriate state is larger than the conditional probability of the out-of-state prediction (largest P = 6.7 × 10⁻⁶ across all comparisons, mann–Whitney U-test). Song-mode predictions were highest when using output filters from the correct state. Center lines of box plots represent the median, the bottom and top edges represent the 25th and 75th percentiles, respectively. Whiskers extend to ±2.7 times the standard deviation. c, The five most predictive output filters for each state and for prediction of each of the three of the types of song. Filters for types of song are relative to no-song filters, which are set to a constant term (see Methods). d, Example output filters for each state revealed that even for the same feedback cues, the GLM–HMM shows distinct patterns of integration. Plotted here are the mFV, mfDist and the mfFV; filters can change sign and shape between states. e, Transfer functions (the conditional probability of observing song choice (y axis) as a function of the magnitude of each feedback cue (x axis)) for producing pulse (both Pslow and Pfast) versus sine have distinct patterns based on state. For mFV (upper), fLS (middle) and mfDist (lower), the average relationship or transfer function between song choice and the movement cue (black line) differs with transfer functions separated by state (blue, green and purple). f, Output filters that predict pulse versus sine song for each of the following three feedback cues: mFV (upper), fLS (middle) and mfDist (lower).

