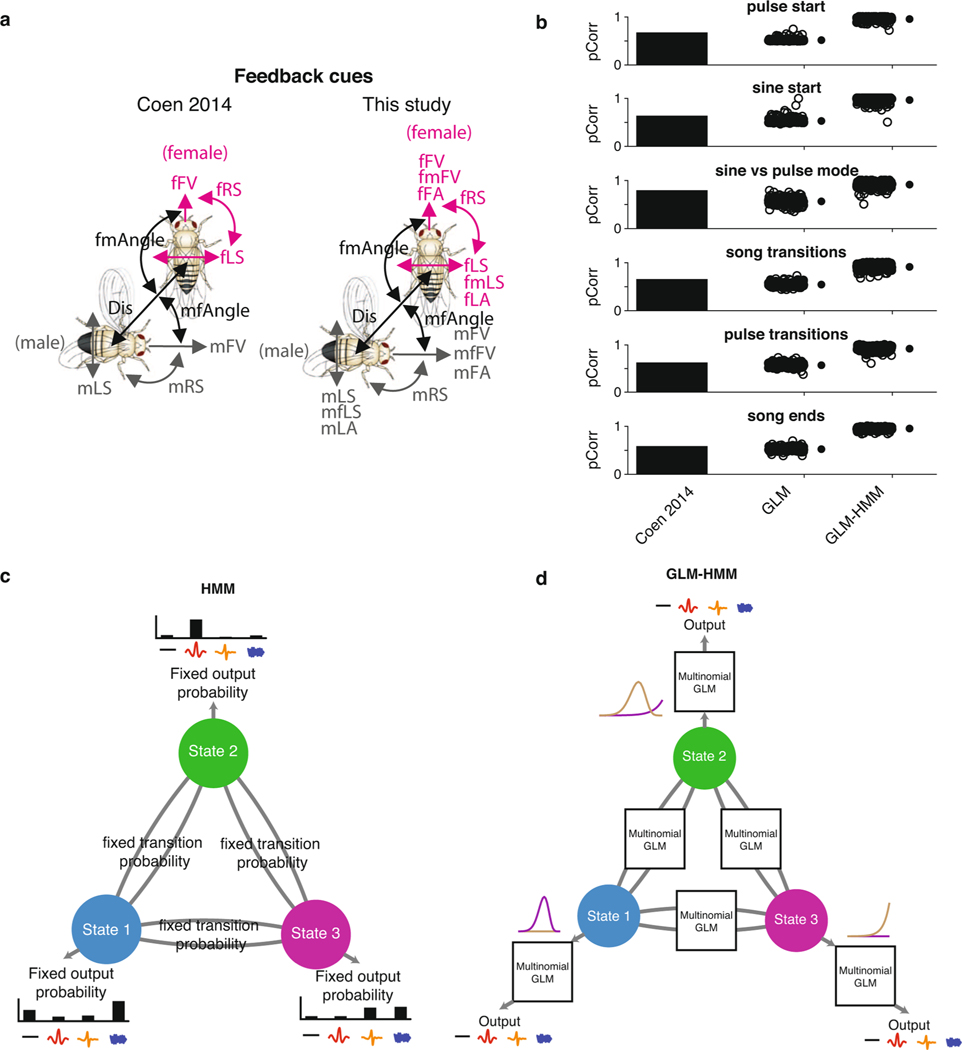
Extended Data Fig. 1 |. Comparison of GLMs and GLM-HMM.
a, Fly feedback cues used for prediction in (Coen et al. 2014) (left) or the current study (right). b, Comparison of model performance using probability correct (‘pCorr’) (see Methods) for predictions from (Coen et al. 2014) (reproduced from that paper) for the single-state GLM (See Fig. 1c) and 3-state GLM-HMM (see Fig. 1d). Each open circle represents predictions from one courtship pair. The same pairs were used when calculating the pCorr value for each condition (GLM and 3-state GLM-HMM); filled circles represent mean +/− SD; 100 shown for visualization purposes. c, Schematic of standard HMM, which has fixed transition and emission probabilities. d, Schematic of GLM-HMM in the same format, with static probabilities replaced by dynamic ones. Example filters from the GLM are indicated with the purple and light brown lines.

