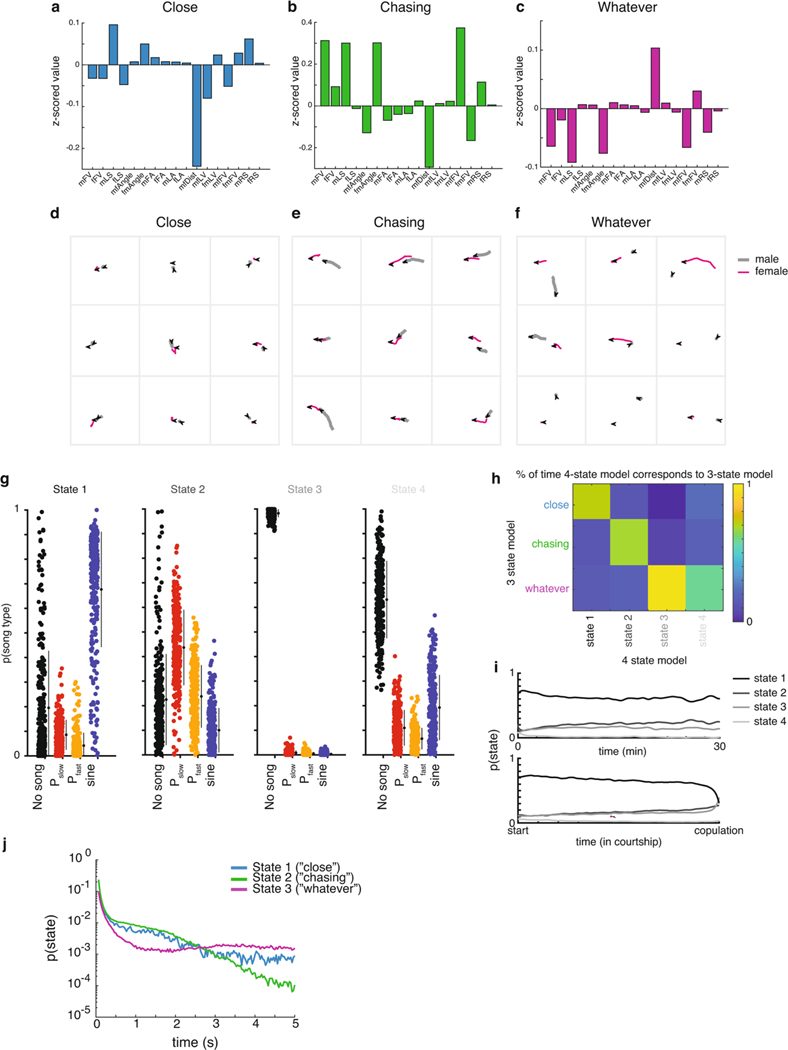
Extended Data Fig. 3 |. Evaluating the states of the GLM-HMM.
a-c. The mean value for each feedback cue in the (a) ‘close’, (b) ‘chasing’, or (c) ‘whatever’ state (see Methods for details on z-scoring). d-f. Representative traces of male and female movement trajectories in each state. Male trajectories are in gray and female trajectories in magenta. Arrows indicate fly orientation at the end of 660 ms. g. In the 4-state GLM-HMM model, the probability of observing each type of song when the animal is in that state. Filled circles represent individual animals (n=276 animals, small black circles with lines are mean +/− SD). h. The correspondence between the 3-state GLM-HMM and the 4-state GLM-HMM. Shown is the conditional probability of the 3-state model being in the ‘close’, ‘chasing’, or ‘whatever’ states given the state of the 4-state model. i. The mean probability across flies of being in each state of the 4-state model when aligned to absolute time (top) or the time of copulation (bottom). j. Probability of state dwell times generated from feedback cues. These show non-exponential dwell times on a y-log plot.

