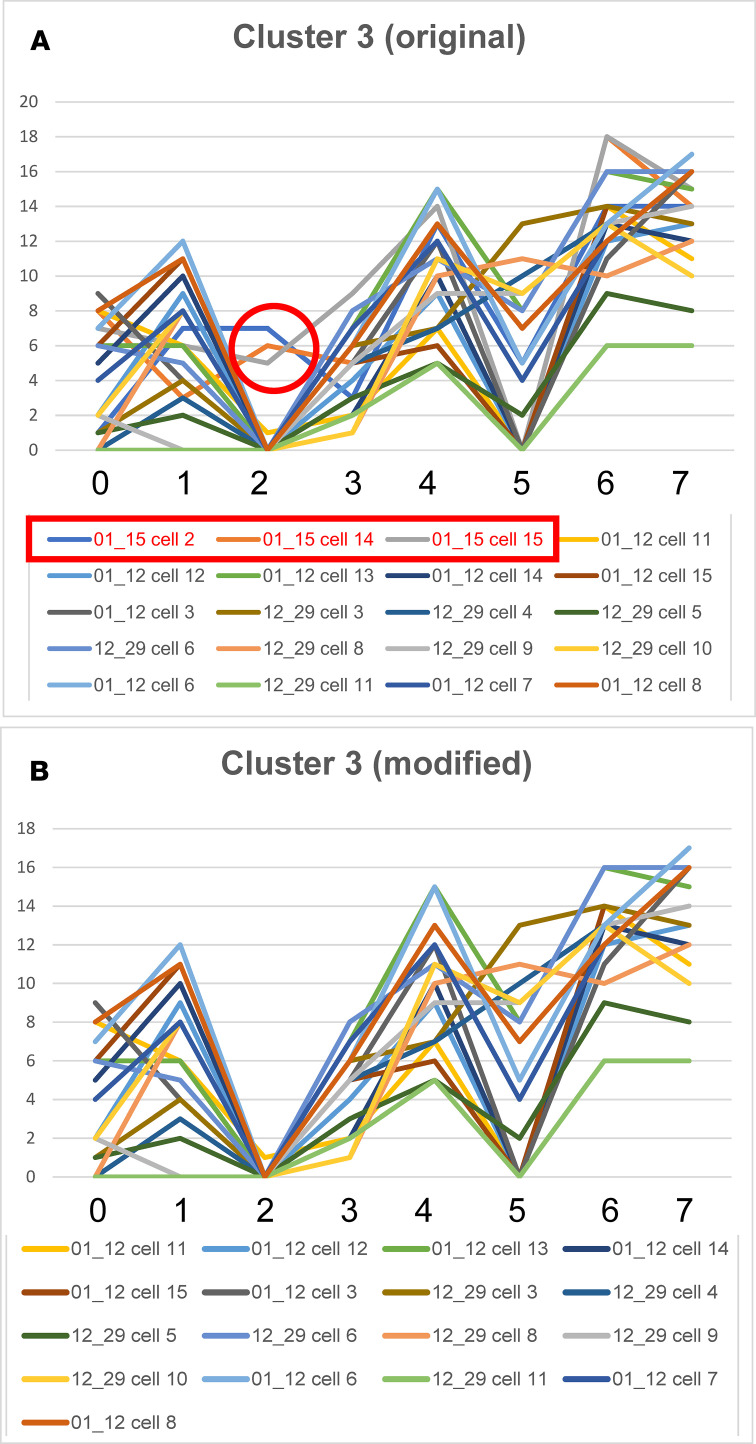
Figure 10. Refining selections.
Cells included in cluster 3 (from Figure 8) and their graphs are shown (A). All cells are SP-A2, except for the first 3 in the legend of panel A (shown in the red rectangle). The red circle encloses a portion of the graph/signature for these 3 KO cells. When these 3 KO cells are removed from the graph (B), the resulting subset is composed entirely of SP-A2 AMs. The identity of the biomarkers is given (Table 1).

