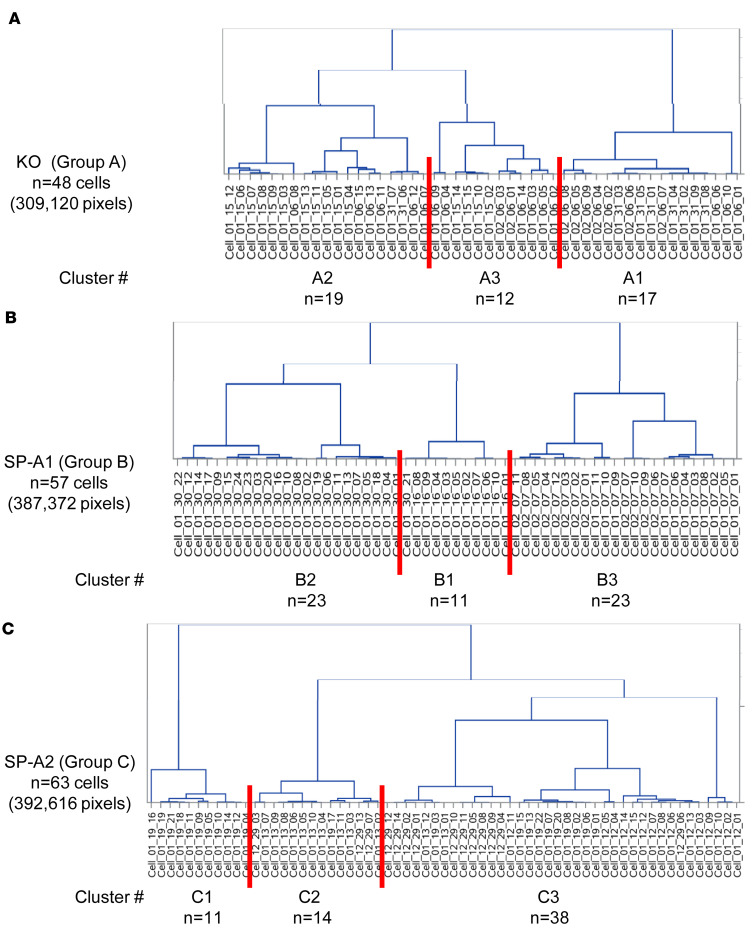
Figure 4. Group-wise clustering analysis.
Clustering was performed on the cells of each experimental group separately: group A (A), group B (B), and group C (C). The identity of each group (KO, SP-A1, SP-A2), the number of cells/group, and the number of pixels are shown on the left of each panel. The dendrogram is shown on the right with the list of included cells across the bottom. The 3 main clusters from each group are delineated by red lines drawn through the cell lists. The designation for each cluster (i.e., A1, A2, A3) and the number of cells/cluster are given.

