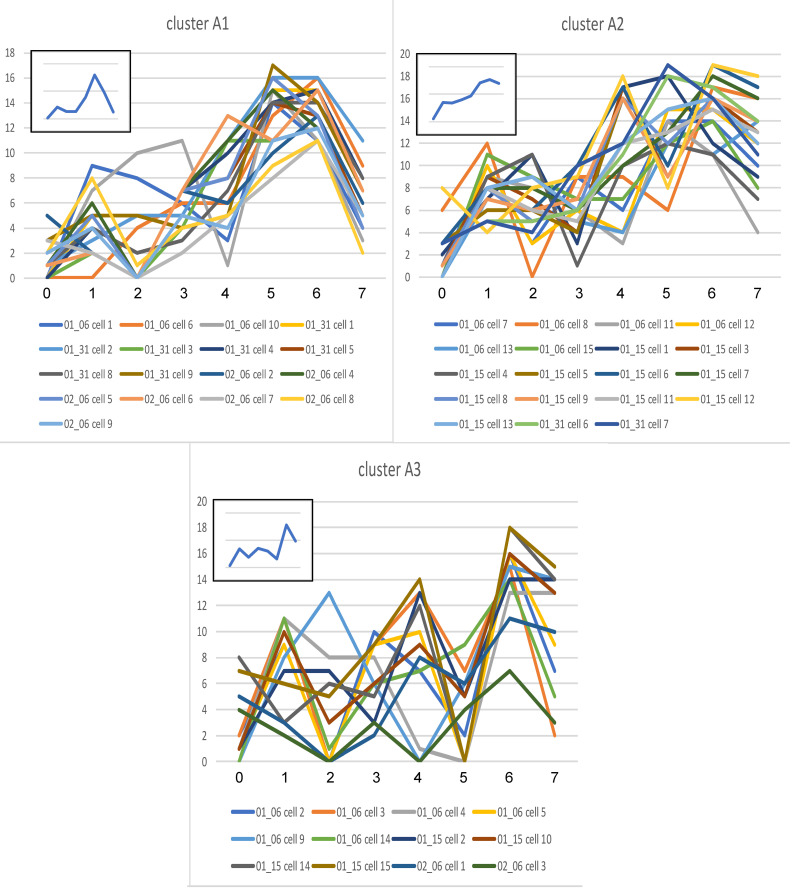
Figure 5. Signatures for cells in KO clusters.
The line graphs from the cells composing each of the 3 main clusters (A1, A2, A3 — Figure 4A) for all AMs from KO mice are shown. The x axis (numbered 0–7) shows individual biomarkers. The identity of the biomarkers is given (Table 1). The y axis shows the number of CMPs in the 20 most abundant CMPs containing each biomarker. Individual cells composing each cluster are provided below each set of graphs. The graph in the inset serves as a summary graph for the multiple individual graphs shown in the main panel and shows the average percentage or intensity (% of pixels containing each biomarker/total # of pixels occupied by CMPs) for each cell in the cluster containing each biomarker.

