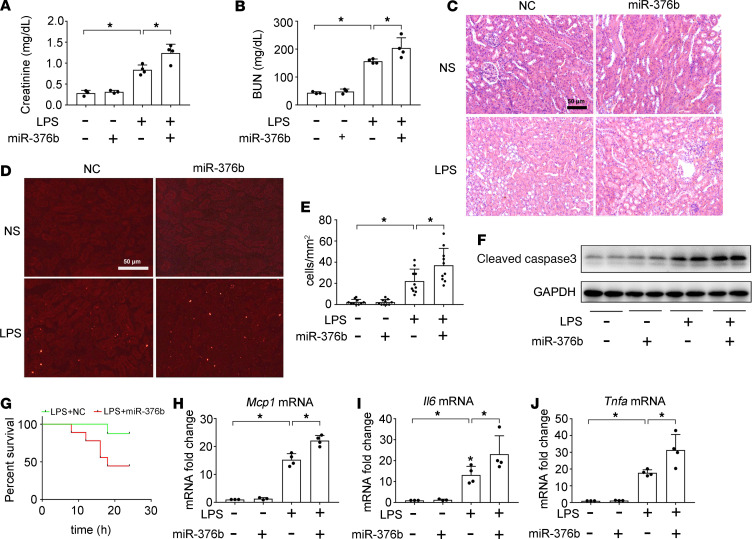
Figure 5. miR-376b mimic worsens LPS-induced septic AKI in mice.
miR-376b mimic (7mg/kg) or NC oligonucleotides were injected into male C57BL/6 mice through tail vein. One day later, the mice were injected intraperitoneally with 10 mg/kg LPS. Control mice were injected with normal saline (NS). Kidney tissues were collected at 24 hours after LPS injection. (A) Serum creatinine. (B) BUN. (C) Representative images of H&E staining. Scale bar: 50 μm. (D) Representative images of TUNEL staining. Scale bar: 50 μm. (E) Quantification of TUNEL-positive cells. (F) Immunoblot analysis of active caspase-3 in septic AKI kidneys. GAPDH was used as loading control. (G) Kaplan-Meier curves showing miR-376b mimic worsens animal death after LPS exposure. (H–J) qPCR analysis of Mcp1, Il6, and Tnfa mRNA. All quantitative data were expressed as mean ± SD (n = 3 or n = 4 in A, B, and H–J and n = 10 in E, 1-way ANOVA with Tukey’s multiple comparisons test),*P < 0.05.

