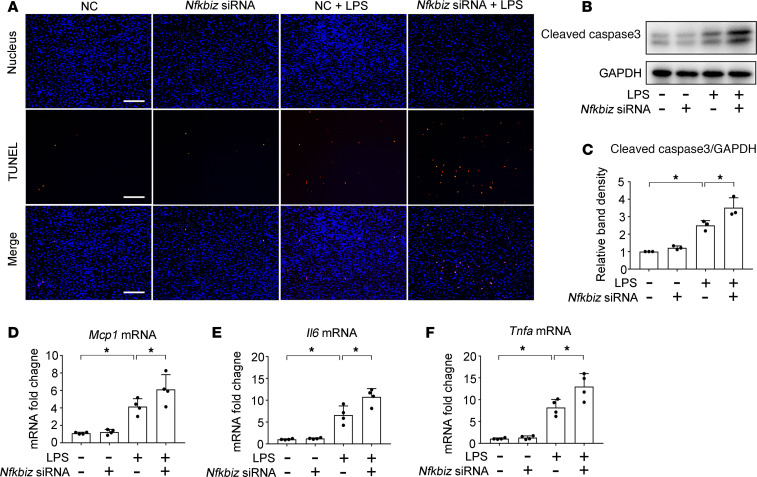
Figure 8. Silencing Nfkbiz enhances LPS-induced apoptosis and inflammatory response in BUMPT cells.
BUMPT cells were transfected with 40 nM Nfkbiz siRNA or NC oligonucleotides and then treated with 10 μg/mL LPS for 8 hours. (A) Representative images of TUNEL staining. Scale bar: 200 μm. (B) Immunoblot analysis of active/cleaved caspase-3. GAPDH was used as a loading control. (C) quantification of active caspase-3. Protein bands in immunoblots were analyzed by densitometry to calculate the signal ratio of active caspase-3/GAPDH with the ratio in control cells were arbitrarily set as 1. Data are expressed as mean ± SD (n = 3, 1-way ANOVA with Tukey’s multiple comparisons test), *P < 0.05. (D–F) qPCR analysis for Mcp1, Il6, and Tnfa. Quantitative data are expressed as mean ± SD (n = 4, 1-way ANOVA with Tukey’s multiple comparisons test),*P < 0.05.

