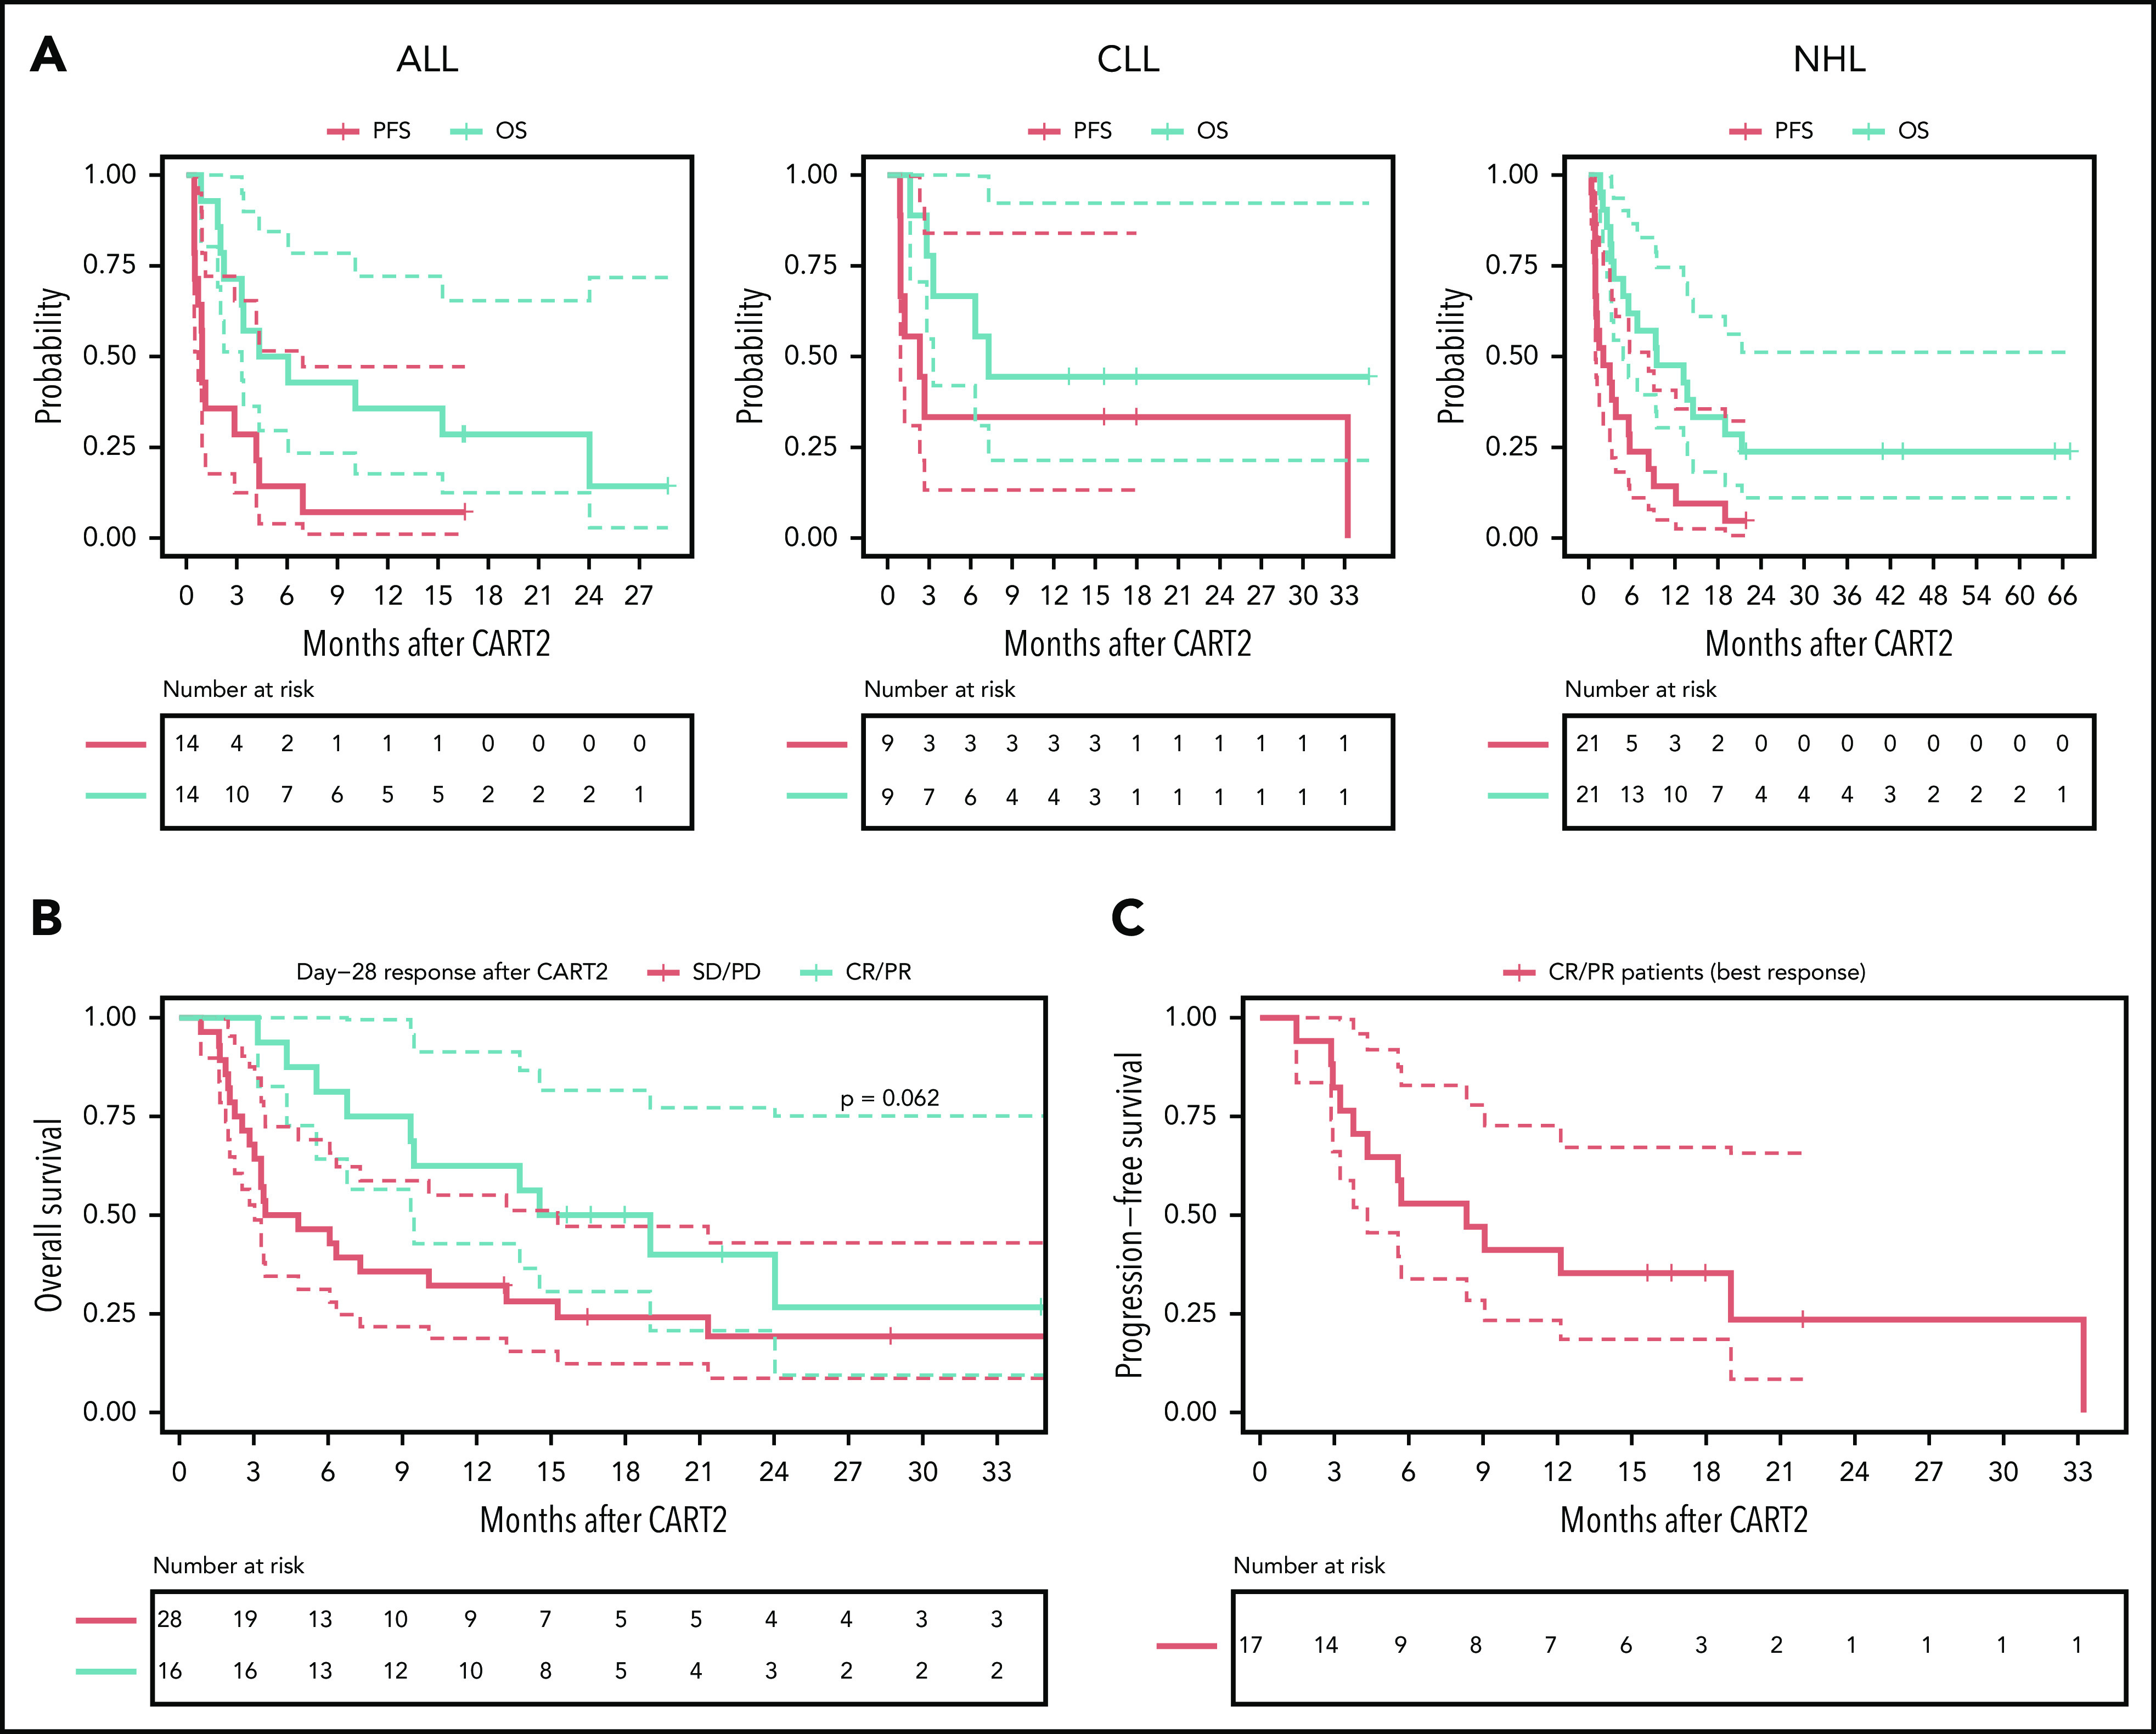
Figure 2.

Outcomes after CART2. (A) OS and PFS probabilities after CART2 in ALL (left), CLL (middle), and NHL (right). (B) OS stratified by day 28 response after CART2. (C) PFS in CR/PR patients (n = 17) after CART2 (best response). Solid lines, Kaplan-Meier estimates; dashed lines, 95% CIs. For the analysis of PFS, an event was defined as no response, relapse or disease progression, or death. Death was the event for analysis of OS. Patients who did not have an event were censored at the date of last follow-up. Data were not censored at the time of initiation of new therapy, including allogeneic HCT, in the absence of disease progression. P values per the log-rank test.
