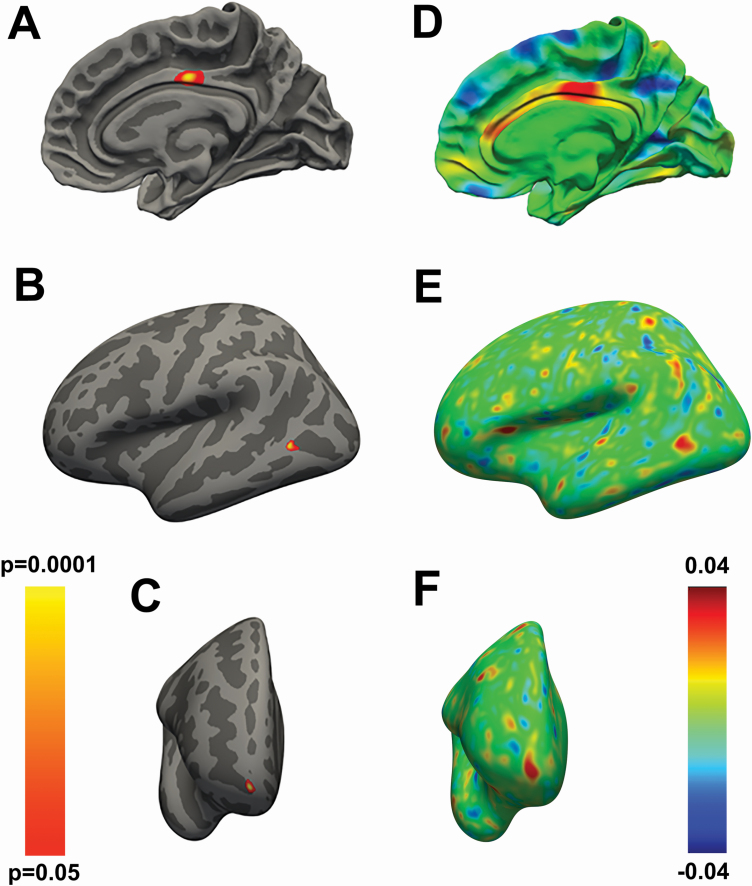
Figure 2.
(A) Vertex-wise statistical map showing the positive association between the quantity of sleep and the regionally specific intracortical myelin content in the mid-posterior cingulate cortex. (B, C) Vertex-wise statistical map showing the negative association between the quality of sleep and the regionally specific intracortical myelin content in the posterior middle temporal gyrus (B) and anterior orbitofrontal cortex (C). (D–F) Effect size maps for the findings respectively presented in panel A–C. The color bar on the left represents the p-values for the maps shown in A–C, while the color bar on the right represents the strength of the effect sizes for the maps displayed in D–F. Covariates of no interest in the GLMs employed to generate the maps in A–F were sex, age, education, body mass index, fluid intelligence, TIV, personality traits as assessed via the NEO-FFI, and time of day when the MRI scanning occurred.

