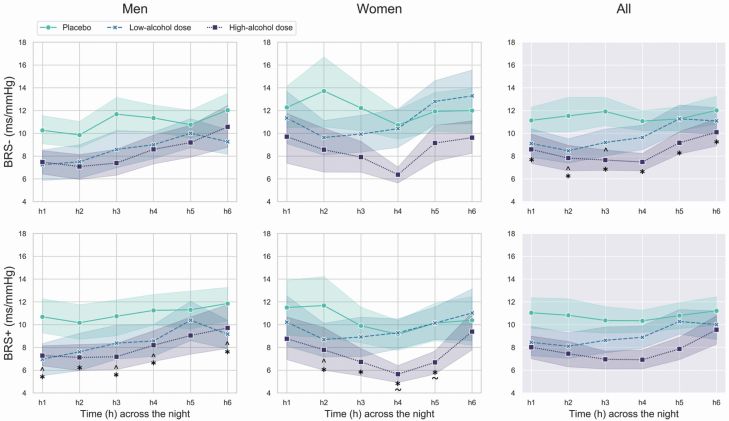
Figure 4.
Mean and standard errors of BRS down (BRS−) and up (BRS+) sequences, across the first 6 h of the placebo, low-alcohol dose, and high-alcohol dose nights in men and women. In the graphs, the significant differences between alcohol conditions are marked by “caret” (low-alcohol dose night vs. placebo night), “asterisk” (high-alcohol dose night vs. placebo night), and “tilde” (high-alcohol dose night vs. low-alcohol dose night).

