Figure 2.

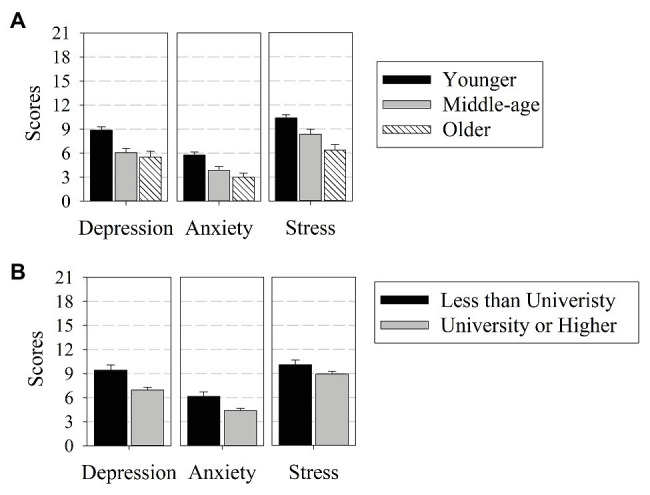
Mean DASS ratings provided by participants of different age groups (A) and education level (B). Error bars indicate 95% CIs.

Mean DASS ratings provided by participants of different age groups (A) and education level (B). Error bars indicate 95% CIs.