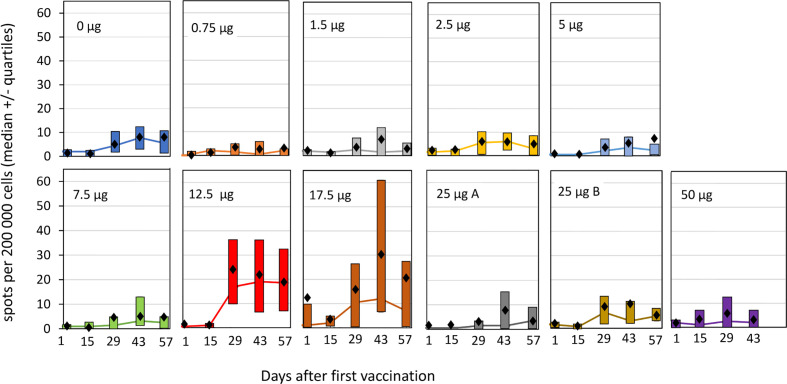
Figure 5.
ELISpot responses against HPV16 E7 by cohorts and timepoint. PBMCs from the study subjects were isolated before and at different time points after vaccination, and subjected to ELISpot analysis after re-stimulation with the HPV E7 peptides used for the vaccination, as described under Materials and Methods. The spot counts for each sample were background corrected for simplified interpretation by subtracting the mean of the negative control wells from each donor from each antigen measurement from that donor. If the difference was <0, it was set to a value of 0. Each panel shows the result for an individual dose group. The lines indicate median values with the upper and lower quartiles indicated by the boxes. Mean values are shown as black diamonds. Group 25 µg A received the normal light dose of 1 J/cm2 at an irradiance of 5 mW/cm2, group 25 µg B received a light dose of 0.5 J/cm2 at an irradiance of 2.5 mW/cm2.

