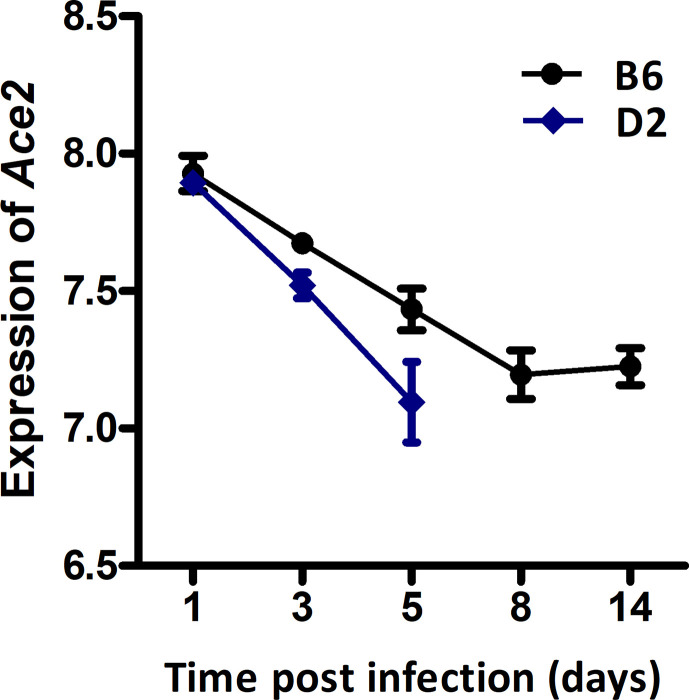
Figure 1.
Line charts of the Ace2 expression level in strains C57BL/6J (B6) and DBA/2J (D2) after H1N1 infection. Lung transcriptomes were quantified with RNA-seq for B6 and D2 strains at 1, 3, 5, 8, and 14 dpi of H1N1 infection. Three female mice (8–12 weeks of age) per strain were used per time point. The x-axis shows the time point (days) post the infection. The y-axis shows the expression level of Ace2 on a log2 transformed scale.

