Figure 2.
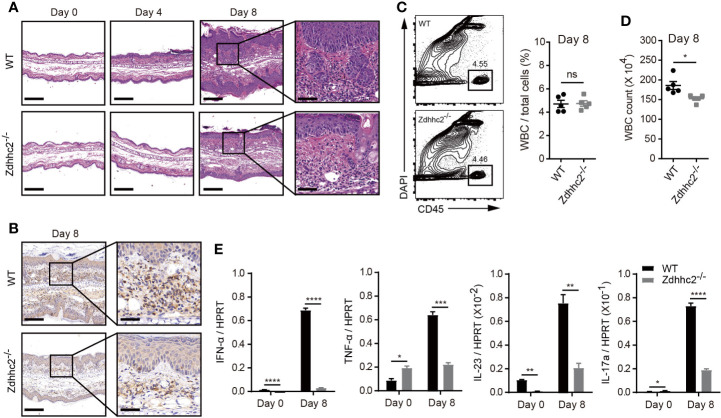
Imiquimod-induced inflammation in Zdhhc2-deficient mice. (A) Representative H&E staining on histological sections of WT and Zdhhc2 deficient ears treated with imiquimod for 0, 4, and 8 days, respectively. (B) Representative IHC staining for CD45 on histological sections of WT and Zdhhc2 deficient ears treated with imiquimod for 8 days. Image captured at 50× magnification, scale bars: 200 µm. Zoomed-in views of selected regions were captured at 200× magnification, scale bars: 50 μm. Experiments were repeated twice, involving three mice for each time point per genotype. (C) The frequency of WBC was analyzed in psoriatic skin of WT and Zdhhc2 deficient mice after 8 days imiquimod treatment. The CD45+ single cells were gated with dead cell exclusion using DAPI a nucleic acid staining dye. (D) Absolute number of WBC were quantified by Attune NxT volumetric flow cytometer. Experiments were involving five mice for each time point per genotype (mean ± SEM). (E) qRT-PCR was performed to analyze the expression level of four pro-inflammation cytokines in WT and Zdhhc2 deficient ears with (8 days) or without (0 days) imiquimod treatment (n = 3, mean ± SEM). * p < 0.05, ** p < 0.01, *** p < 0.001, **** p < 0.0001, unpaired Student’s t-test. ns, not significant.

