Figure 3.
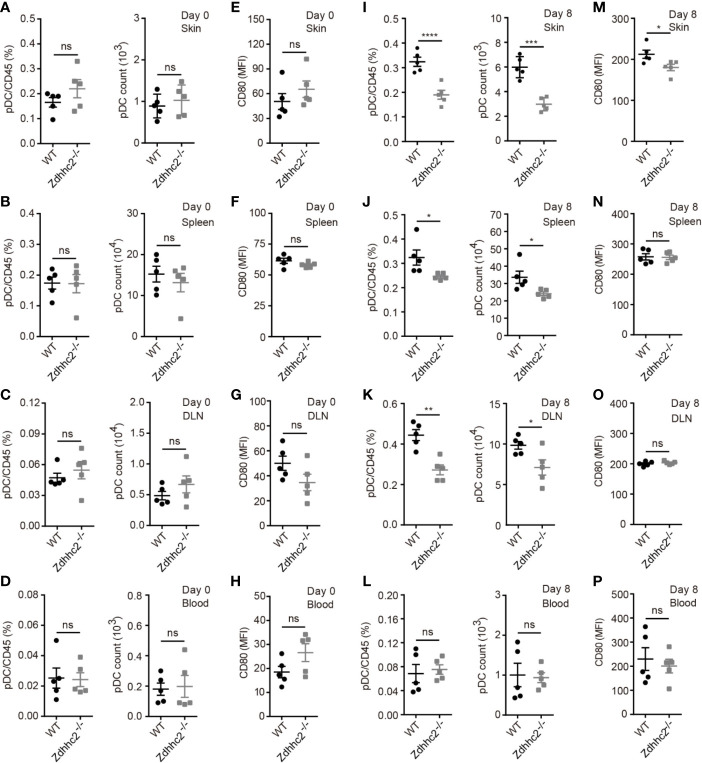
The pDC analysis in four types of organs of WT and Zdhhc2−/− mice following imiquimod treatment for 0 and 8 days. (A, I) Comparison of the pDC frequencies in WBC and pDC absolute number in the lesioned skin of WT and Zdhhc2−/− mice after 0 and 8 days imiquimod stimulation. (E, M) Mean fluorescence intensity (MFI) of CD80 for pDC in the lesioned skin of WT and Zdhhc2−/− mice after 0 and 8 days imiquimod stimulation. (B, J) Comparison of the pDC frequencies in WBC and pDC absolute number in the spleen of WT and Zdhhc2−/− mice after 0 and 8 days imiquimod stimulation. (F, N) MFI of CD80 for pDC in the spleen of WT and Zdhhc2−/− mice after 0 and 8 days imiquimod stimulation. (C, K) Comparison of the pDC frequencies in WBC and pDC absolute number in the DLN of WT and Zdhhc2−/− mice after 0 and 8 days imiquimod stimulation. (G, O) MFI of CD80 for pDC in the DLN of WT and Zdhhc2−/− mice after 0 and 8 days imiquimod stimulation. (D, L) Comparison of the pDC frequencies in WBC and pDC absolute number in the blood of WT and Zdhhc2−/− mice after 0 and 8 days imiquimod stimulation. (H, P) MFI of CD80 for pDC in the blood of WT and Zdhhc2−/− mice after 0 and 8 days imiquimod stimulation (mean ± SEM). Experiments were involving five mice for each time point per genotype (mean ± SEM). * p < 0.05, ** p < 0.01, *** p < 0.001, **** p < 0.0001, unpaired Student’s t-test. ns, not significant.

